

Corak sebenar

Double Top
was formed on 01.04 at 02:15:45 (UTC+0)
signal strength 2 of 5
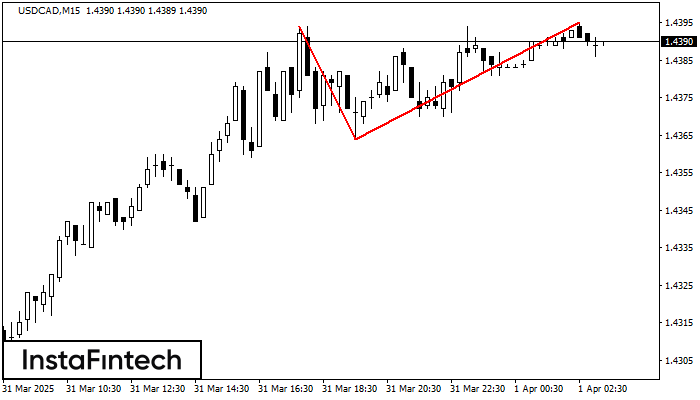
The Double Top reversal pattern has been formed on USDCAD M15. Characteristics: the upper boundary 1.4394; the lower boundary 1.4364; the width of the pattern is 31 points. Sell trades are better to be opened below the lower boundary 1.4364 with a possible movements towards the 1.4341 level.
The M5 and M15 time frames may have more false entry points.
Juga lihat
- All
- All
- Bearish Rectangle
- Bearish Symmetrical Triangle
- Bearish Symmetrical Triangle
- Bullish Rectangle
- Double Top
- Double Top
- Triple Bottom
- Triple Bottom
- Triple Top
- Triple Top
- All
- All
- Buy
- Sale
- All
- 1
- 2
- 3
- 4
- 5
Triple Top
was formed on 30.05 at 22:20:23 (UTC+0)
signal strength 1 of 5

Corak Triple Top telah dibentuk pada carta bagi instrumen dagangan GOLD M5. Ia adalah corak pembalikan yang memaparkan ciri-ciri berikut: tahap rintangan 4, tahap sokongan -193, dan lebar corak
Carta masa M5 dan M15 mungkin mempunyai lebih banyak titik kemasukan palsu.
Open chart in a new window
Inverse Head dan Shoulder
was formed on 30.05 at 21:50:24 (UTC+0)
signal strength 1 of 5

Berdasarkan carta M5, #AMZN menghasilkan corak yang dinyatakan Inverse Head dan Shoulder. Head telah ditetapkan pada 201.64 manakala garisan median Neck ditetapkan pada 204.52/205.01. Pembentukan Corak Inverse Head dan Shoulder
Carta masa M5 dan M15 mungkin mempunyai lebih banyak titik kemasukan palsu.
Open chart in a new window
Segi Empat Menurun
was formed on 30.05 at 21:36:36 (UTC+0)
signal strength 1 of 5

Berdasarkan carta M5, GBPAUD telah membentuk Segi Empat Menurun yang merupakan corak kesinambungan aliran. Corak terkandung dalam sempadan berikut: sempadan bawah 2.0897 – 2.0897 dan sempadan atas 2.0908 – 2.0908
Carta masa M5 dan M15 mungkin mempunyai lebih banyak titik kemasukan palsu.
Open chart in a new window


