

Corak sebenar

Double Bottom
was formed on 31.03 at 02:40:33 (UTC+0)
signal strength 1 of 5
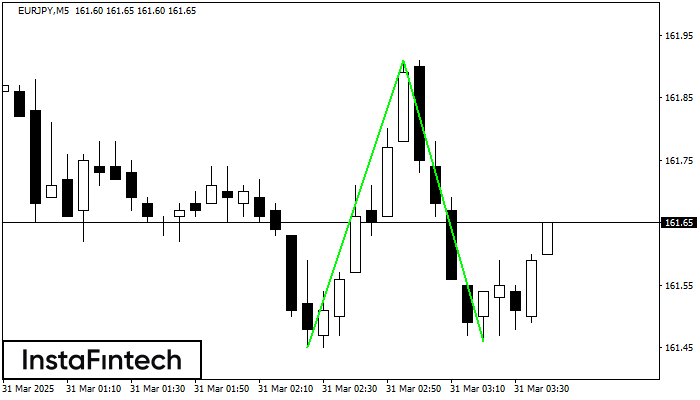
The Double Bottom pattern has been formed on EURJPY M5. This formation signals a reversal of the trend from downwards to upwards. The signal is that a buy trade should be opened after the upper boundary of the pattern 161.91 is broken. The further movements will rely on the width of the current pattern 46 points.
The M5 and M15 time frames may have more false entry points.
Juga lihat
- All
- All
- Bearish Rectangle
- Bearish Symmetrical Triangle
- Bearish Symmetrical Triangle
- Bullish Rectangle
- Double Top
- Double Top
- Triple Bottom
- Triple Bottom
- Triple Top
- Triple Top
- All
- All
- Buy
- Sale
- All
- 1
- 2
- 3
- 4
- 5
Bullish Rectangle
сформирован 14.04 в 08:47:26 (UTC+0)
сила сигнала 1 из 5
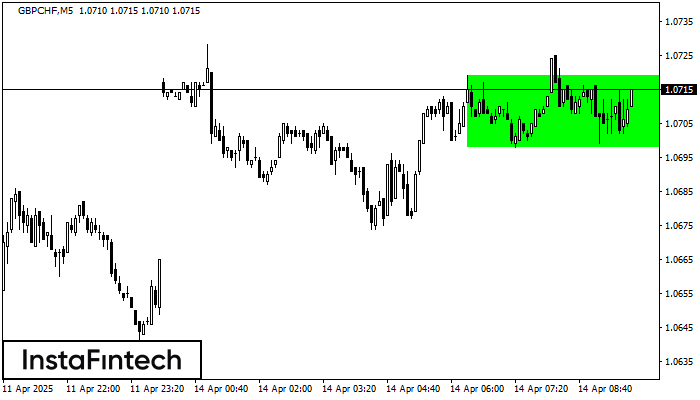
According to the chart of M5, GBPCHF formed the Bullish Rectangle which is a pattern of a trend continuation. The pattern is contained within the following borders: the lower border
The M5 and M15 time frames may have more false entry points.
Открыть график инструмента в новом окне
Triple Bottom
сформирован 14.04 в 08:00:19 (UTC+0)
сила сигнала 2 из 5
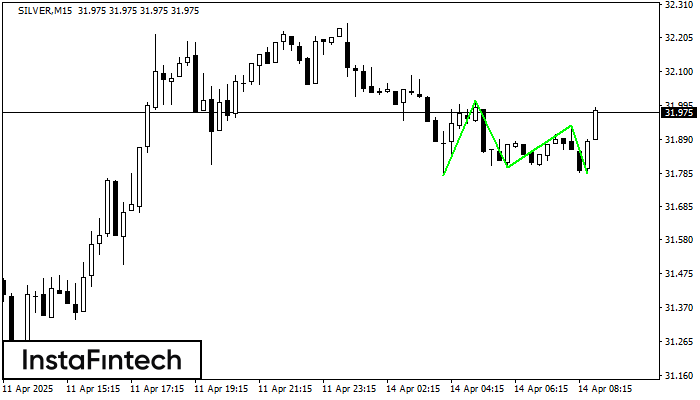
The Triple Bottom pattern has formed on the chart of the SILVER M15 trading instrument. The pattern signals a change in the trend from downwards to upwards in the case
The M5 and M15 time frames may have more false entry points.
Открыть график инструмента в новом окне
Triple Top
сформирован 14.04 в 07:35:12 (UTC+0)
сила сигнала 1 из 5
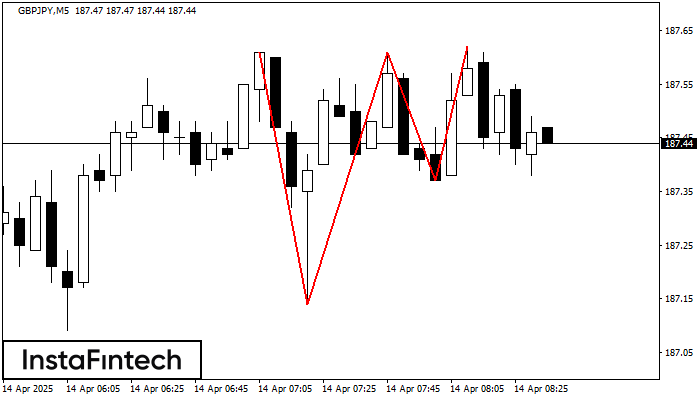
The Triple Top pattern has formed on the chart of the GBPJPY M5. Features of the pattern: borders have an ascending angle; the lower line of the pattern
The M5 and M15 time frames may have more false entry points.
Открыть график инструмента в новом окне


