

Corak sebenar

Triple Top
was formed on 29.03 at 23:35:32 (UTC+0)
signal strength 1 of 5

The Triple Top pattern has formed on the chart of the #Bitcoin M5 trading instrument. It is a reversal pattern featuring the following characteristics: resistance level 50, support level -21012, and pattern’s width 47477. Forecast If the price breaks through the support level 82165.38, it is likely to move further down to 82748.85.
The M5 and M15 time frames may have more false entry points.
- All
- All
- Bearish Rectangle
- Bearish Symmetrical Triangle
- Bearish Symmetrical Triangle
- Bullish Rectangle
- Double Top
- Double Top
- Triple Bottom
- Triple Bottom
- Triple Top
- Triple Top
- All
- All
- Buy
- Sale
- All
- 1
- 2
- 3
- 4
- 5
Bearish Rectangle
was formed on 02.06 at 16:03:51 (UTC+0)
signal strength 5 of 5

According to the chart of D1, #PEP formed the Bearish Rectangle. This type of a pattern indicates a trend continuation. It consists of two levels: resistance 132.70 - 0.00
Open chart in a new window
Bearish Rectangle
was formed on 02.06 at 16:03:49 (UTC+0)
signal strength 5 of 5
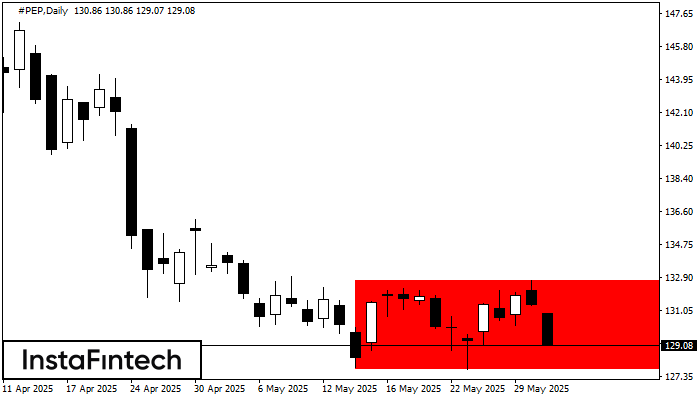
According to the chart of D1, #PEP formed the Bearish Rectangle which is a pattern of a trend continuation. The pattern is contained within the following borders: lower border 127.74
Open chart in a new window
Double Bottom
was formed on 02.06 at 15:34:51 (UTC+0)
signal strength 1 of 5
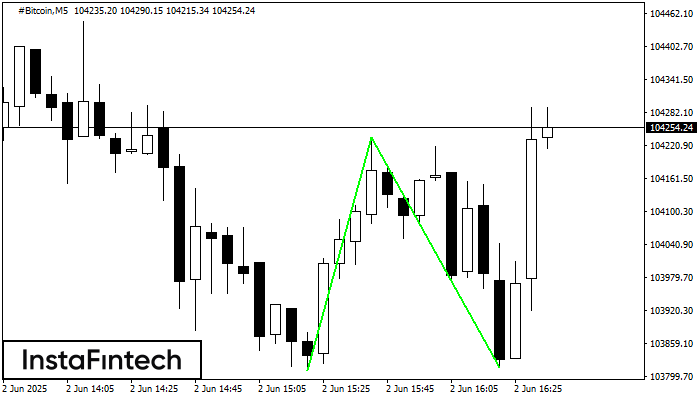
The Double Bottom pattern has been formed on #Bitcoin M5; the upper boundary is 104236.07; the lower boundary is 103815.25. The width of the pattern is 42583 points. In case
The M5 and M15 time frames may have more false entry points.
Open chart in a new window

