

Corak sebenar

Inverse Head and Shoulder
was formed on 29.03 at 22:00:17 (UTC+0)
signal strength 2 of 5

According to the chart of M15, #Bitcoin produced the pattern termed the Inverse Head and Shoulder. The Head is fixed at 81609.29 while the median line of the Neck is set at 82839.07/82640.15. The formation of the Inverse Head and Shoulder Pattern clearly indicates a reversal of the downward trend. In means that in case the scenario comes true, the price of #Bitcoin will go towards 82640.38.
The M5 and M15 time frames may have more false entry points.
Juga lihat
- All
- All
- Bearish Rectangle
- Bearish Symmetrical Triangle
- Bearish Symmetrical Triangle
- Bullish Rectangle
- Double Top
- Double Top
- Triple Bottom
- Triple Bottom
- Triple Top
- Triple Top
- All
- All
- Buy
- Sale
- All
- 1
- 2
- 3
- 4
- 5
ডাবল টপ
was formed on 30.05 at 18:30:13 (UTC+0)
signal strength 2 of 5
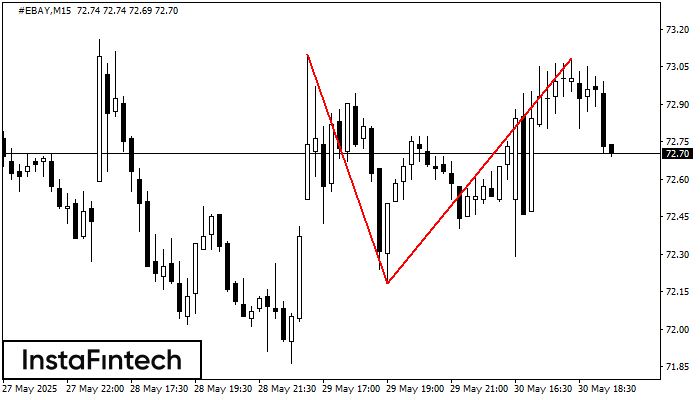
M15 চার্টে, #EBAY-এর ডাবল টপ রিভার্সাল বা বিপরীতমুখী প্যাটার্ন গঠিত হয়েছে। বৈশিষ্ট্য: উপরের সীমানা 73.10; নীচের সীমানা 72.18; প্যাটার্নের প্রস্থ হল 90 পয়েন্ট। 72.18 71.96 স্তরের দিকে সম্ভাব্য মুভমেন্টের সাথে
M5 এবং M15 টাইম ফ্রেমে আরও ভুল এন্ট্রি পয়েন্ট থাকতে পারে।
Open chart in a new window
বুলিশ রেক্ট্যাঙ্গেল
was formed on 30.05 at 18:25:46 (UTC+0)
signal strength 1 of 5
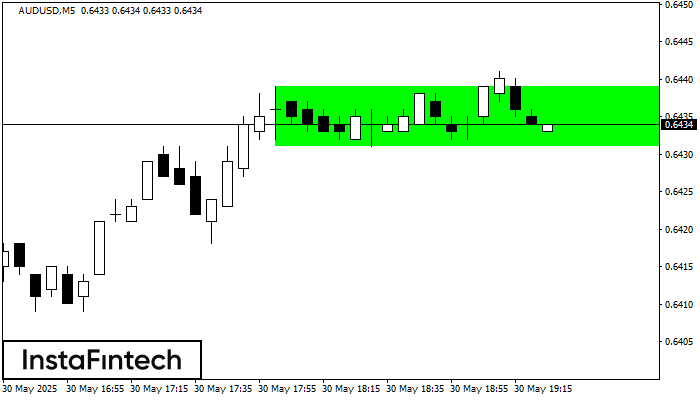
M5 চার্ট অনুযায়ী, AUDUSD বুলিশ রেক্ট্যাঙ্গেল গঠন করেছে। এই প্যাটার্ন এই ধরনের প্রবণতার ধারাবাহিকতার নির্দেশ করে. এটি দুটি স্তর নিয়ে গঠিত: 0.6439 -এর রেজিস্ট্যান্স এবং 0.6431 -এর সাপোর্ট৷ রেজিস্ট্যান্স স্তর
M5 এবং M15 টাইম ফ্রেমে আরও ভুল এন্ট্রি পয়েন্ট থাকতে পারে।
Open chart in a new window
ডাবল টপ
was formed on 30.05 at 18:22:18 (UTC+0)
signal strength 1 of 5
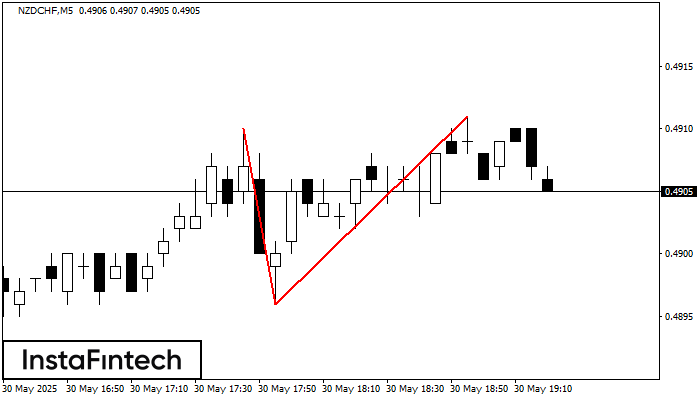
M5 চার্টে, NZDCHF-এর ডাবল টপ প্যাটার্নটি গঠিত হয়েছে। এটি এই ইঙ্গিত দেয় যে চলমান প্রবণতা ঊর্ধ্বমুখী থেকে নিম্নমুখীতে পরিবর্তিত হয়েছে। সম্ভবত, যদি 0.4896 প্যাটার্নের ভিত্তিটি ব্রেক করা হয়, তাহলে নিম্নমুখী
M5 এবং M15 টাইম ফ্রেমে আরও ভুল এন্ট্রি পয়েন্ট থাকতে পারে।
Open chart in a new window


