

Corak sebenar

Double Top
was formed on 29.03 at 20:55:27 (UTC+0)
signal strength 1 of 5
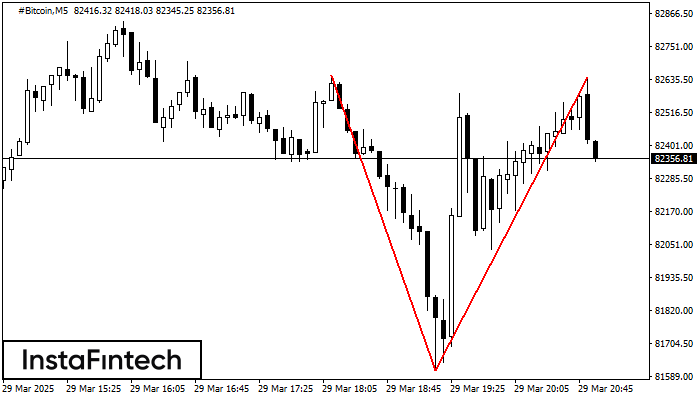
The Double Top reversal pattern has been formed on #Bitcoin M5. Characteristics: the upper boundary 82648.20; the lower boundary 81609.29; the width of the pattern is 103086 points. Sell trades are better to be opened below the lower boundary 81609.29 with a possible movements towards the 81609.14 level.
The M5 and M15 time frames may have more false entry points.
Juga lihat
- All
- All
- Bearish Rectangle
- Bearish Symmetrical Triangle
- Bearish Symmetrical Triangle
- Bullish Rectangle
- Double Top
- Double Top
- Triple Bottom
- Triple Bottom
- Triple Top
- Triple Top
- All
- All
- Buy
- Sale
- All
- 1
- 2
- 3
- 4
- 5
Bearish Symmetrical Triangle
was formed on 10.04 at 19:40:42 (UTC+0)
signal strength 1 of 5
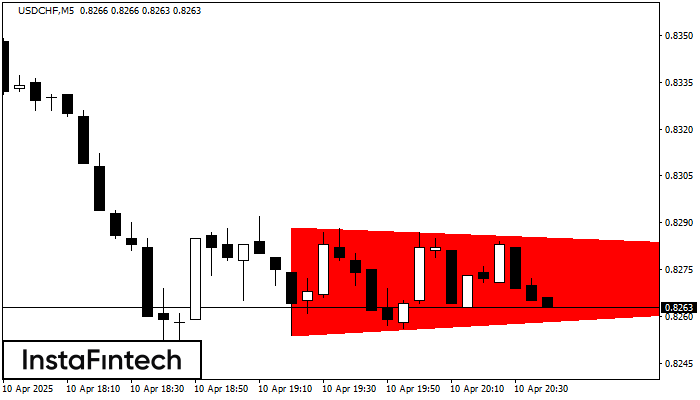
According to the chart of M5, USDCHF formed the Bearish Symmetrical Triangle pattern. This pattern signals a further downward trend in case the lower border 0.8254 is breached. Here
The M5 and M15 time frames may have more false entry points.
Open chart in a new window
Bullish Symmetrical Triangle
was formed on 10.04 at 19:35:35 (UTC+0)
signal strength 1 of 5
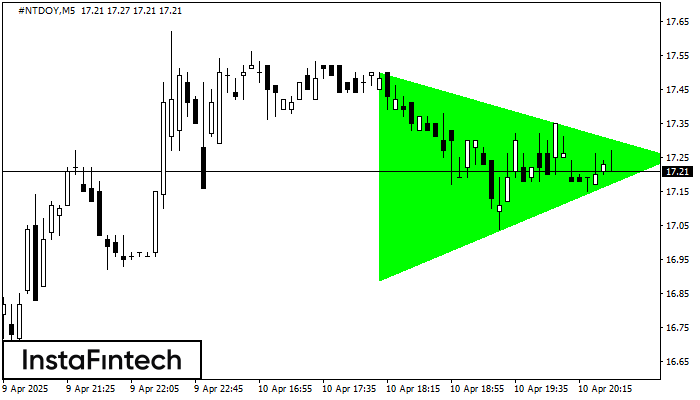
According to the chart of M5, #NTDOY formed the Bullish Symmetrical Triangle pattern. Description: This is the pattern of a trend continuation. 17.50 and 16.89 are the coordinates
The M5 and M15 time frames may have more false entry points.
Open chart in a new window
Bullish Symmetrical Triangle
was formed on 10.04 at 19:35:26 (UTC+0)
signal strength 1 of 5
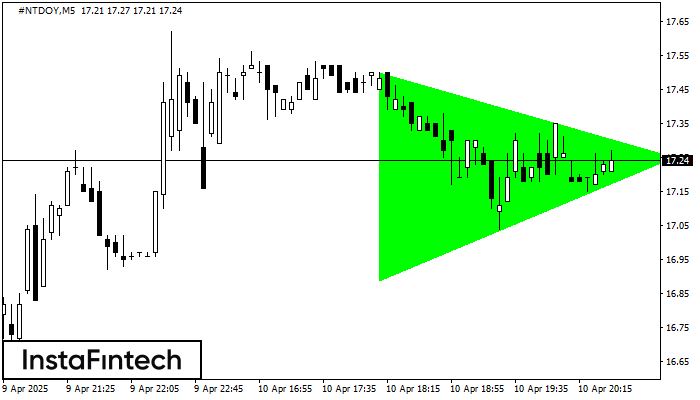
According to the chart of M5, #NTDOY formed the Bullish Symmetrical Triangle pattern. Description: This is the pattern of a trend continuation. 17.50 and 16.89 are the coordinates
The M5 and M15 time frames may have more false entry points.
Open chart in a new window


