

Corak sebenar

Double Bottom
was formed on 29.03 at 11:00:31 (UTC+0)
signal strength 3 of 5

The Double Bottom pattern has been formed on #Bitcoin M30. Characteristics: the support level 83552.05; the resistance level 84588.82; the width of the pattern 103677 points. If the resistance level is broken, a change in the trend can be predicted with the first target point lying at the distance of 96966 points.
Juga lihat
- All
- All
- Bearish Rectangle
- Bearish Symmetrical Triangle
- Bearish Symmetrical Triangle
- Bullish Rectangle
- Double Top
- Double Top
- Triple Bottom
- Triple Bottom
- Triple Top
- Triple Top
- All
- All
- Buy
- Sale
- All
- 1
- 2
- 3
- 4
- 5
Inverse Head and Shoulder
was formed on 05.06 at 21:40:13 (UTC+0)
signal strength 1 of 5

According to the chart of M5, #MCD produced the pattern termed the Inverse Head and Shoulder. The Head is fixed at 307.79 while the median line of the Neck
The M5 and M15 time frames may have more false entry points.
Open chart in a new window
Bearish Symmetrical Triangle
was formed on 05.06 at 21:16:00 (UTC+0)
signal strength 1 of 5

According to the chart of M5, #NTDOY formed the Bearish Symmetrical Triangle pattern. Description: The lower border is 20.47/20.60 and upper border is 20.74/20.60. The pattern width is measured
The M5 and M15 time frames may have more false entry points.
Open chart in a new window
Bearish Symmetrical Triangle
was formed on 05.06 at 21:15:52 (UTC+0)
signal strength 1 of 5
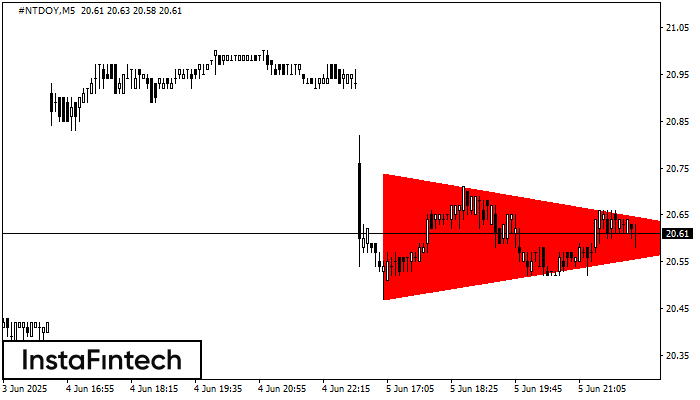
According to the chart of M5, #NTDOY formed the Bearish Symmetrical Triangle pattern. Trading recommendations: A breach of the lower border 20.47 is likely to encourage a continuation
The M5 and M15 time frames may have more false entry points.
Open chart in a new window


