

Corak sebenar

Bullish Rectangle
was formed on 28.03 at 22:34:02 (UTC+0)
signal strength 3 of 5

According to the chart of M30, GOLD formed the Bullish Rectangle which is a pattern of a trend continuation. The pattern is contained within the following borders: the lower border 3065.51 – 3065.51 and upper border 3086.32 – 3086.32. In case the upper border is broken, the instrument is likely to follow the upward trend.
Juga lihat
- All
- All
- Bearish Rectangle
- Bearish Symmetrical Triangle
- Bearish Symmetrical Triangle
- Bullish Rectangle
- Double Top
- Double Top
- Triple Bottom
- Triple Bottom
- Triple Top
- Triple Top
- All
- All
- Buy
- Sale
- All
- 1
- 2
- 3
- 4
- 5
Double Bottom
was formed on 08.08 at 22:31:28 (UTC+0)
signal strength 1 of 5
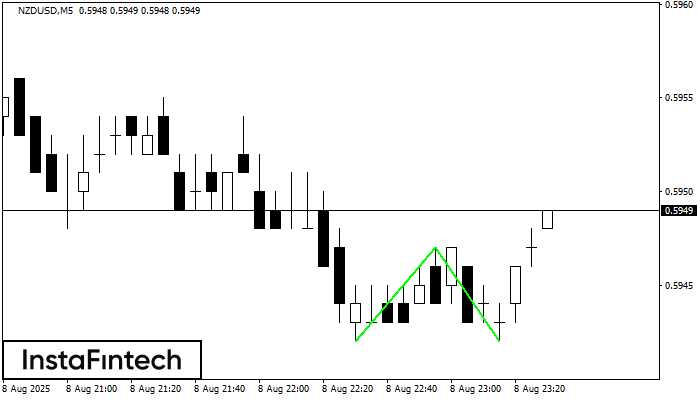
Corak Double Bottom telah dibentuk pada NZDUSD M5; sempadan atas adalah 0.5947; sempadan bawah adalah 0.5942. Lebar corak adalah 5 mata. Sekiranya penembusan sempadan atas 0.5947, perubahan aliran boleh diramalkan
Carta masa M5 dan M15 mungkin mempunyai lebih banyak titik kemasukan palsu.
Open chart in a new window
Double Top
was formed on 08.08 at 21:30:13 (UTC+0)
signal strength 3 of 5
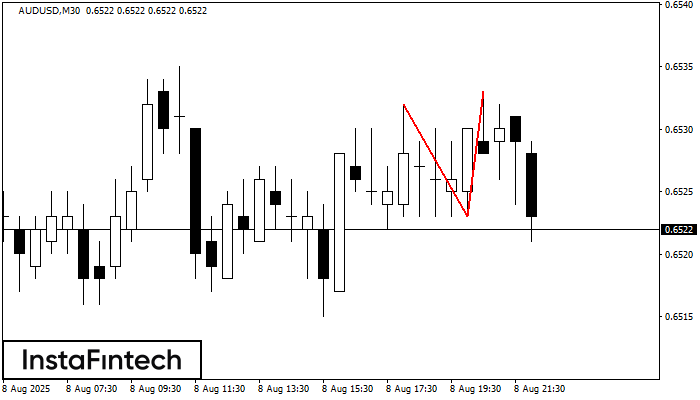
Corak Double Top telah dibentuk pada AUDUSD M30. Isyarat bahawa aliran telah berubah dari aliran menaik ke aliran menurun. Mungkin, sekiranya asas corak 0.6523 ditembusi, pergerakan menurun akan berterusan
Open chart in a new window
Pennant Aliran Menaik
was formed on 08.08 at 21:12:19 (UTC+0)
signal strength 3 of 5
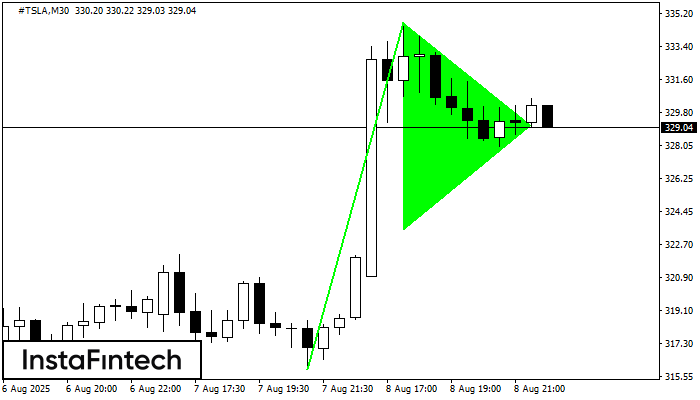
Corak Pennant Aliran Menaik adalah dibentuk pada carta #TSLA M30. Ia adalah jenis corak kesinambungan. Seandainya, sekiranya harga adalah tetap di atas paras tinggi Pennant 334.72, arah aliran menaik selanjutnya
Open chart in a new window


