

Corak sebenar

Double Bottom
was formed on 28.03 at 15:29:59 (UTC+0)
signal strength 3 of 5
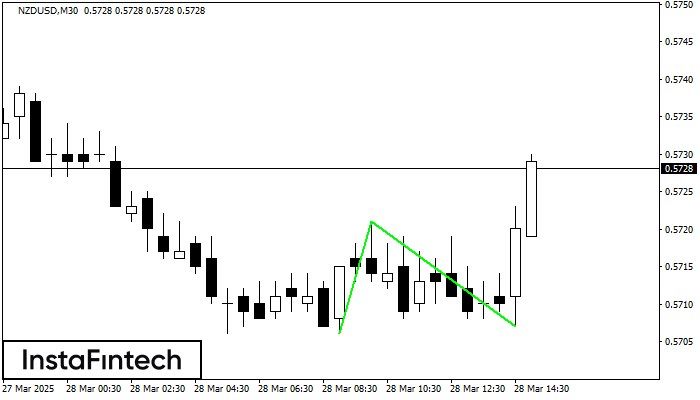
The Double Bottom pattern has been formed on NZDUSD M30. Characteristics: the support level 0.5706; the resistance level 0.5721; the width of the pattern 15 points. If the resistance level is broken, a change in the trend can be predicted with the first target point lying at the distance of 14 points.
Juga lihat
- All
- All
- Bearish Rectangle
- Bearish Symmetrical Triangle
- Bearish Symmetrical Triangle
- Bullish Rectangle
- Double Top
- Double Top
- Triple Bottom
- Triple Bottom
- Triple Top
- Triple Top
- All
- All
- Buy
- Sale
- All
- 1
- 2
- 3
- 4
- 5
Double Top
was formed on 06.06 at 22:30:10 (UTC+0)
signal strength 2 of 5

Pada carta USDCAD M15 corak pembalikan Double Top telah terbentuk. Ciri-ciri: sempadan atas 1.3702; sempadan bawah 1.3668; lebar corak 34 mata. Isyarat: penembusan sempadan bawah akan menyebabkan kesinambungan arah aliran
Carta masa M5 dan M15 mungkin mempunyai lebih banyak titik kemasukan palsu.
Open chart in a new window
Segi Tiga Simetri Menaik
was formed on 06.06 at 22:18:11 (UTC+0)
signal strength 2 of 5

Berdasarkan carta M15, AUDJPY membentuk corak Segi Tiga Simetri Menaik. Sempadan yang lebih rendah bagi corak yang menyentuh koordinat 93.96/94.02 di mana sempadan atas merentasi 94.07/94.02. Sekiranya corak Segi Tiga
Carta masa M5 dan M15 mungkin mempunyai lebih banyak titik kemasukan palsu.
Open chart in a new window
Triple Bottom
was formed on 06.06 at 22:01:08 (UTC+0)
signal strength 3 of 5

Corak Triple Bottom telah dibentuk pada carta bagi instrumen dagangan GBPAUD M30. Corak menandakan perubahan aliran dari menurun ke aliran menaik dalam sekiranya penembusan 2.0879/2.0852
Open chart in a new window


