

Corak sebenar

Triple Top
was formed on 27.03 at 04:30:09 (UTC+0)
signal strength 2 of 5
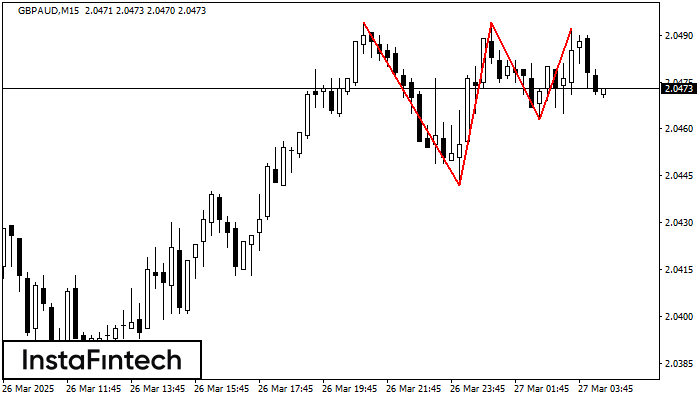
On the chart of the GBPAUD M15 trading instrument, the Triple Top pattern that signals a trend change has formed. It is possible that after formation of the third peak, the price will try to break through the resistance level 2.0442, where we advise to open a trading position for sale. Take profit is the projection of the pattern’s width, which is 52 points.
The M5 and M15 time frames may have more false entry points.
- All
- All
- Bearish Rectangle
- Bearish Symmetrical Triangle
- Bearish Symmetrical Triangle
- Bullish Rectangle
- Double Top
- Double Top
- Triple Bottom
- Triple Bottom
- Triple Top
- Triple Top
- All
- All
- Buy
- Sale
- All
- 1
- 2
- 3
- 4
- 5
Double Top
was formed on 17.04 at 06:00:30 (UTC+0)
signal strength 3 of 5

On the chart of EURJPY M30 the Double Top reversal pattern has been formed. Characteristics: the upper boundary 162.23; the lower boundary 161.48; the width of the pattern 75 points
Open chart in a new window
Double Bottom
was formed on 17.04 at 05:55:25 (UTC+0)
signal strength 1 of 5

The Double Bottom pattern has been formed on AUDUSD M5. Characteristics: the support level 0.6353; the resistance level 0.6366; the width of the pattern 13 points. If the resistance level
The M5 and M15 time frames may have more false entry points.
Open chart in a new window
Bearish Rectangle
was formed on 17.04 at 05:27:54 (UTC+0)
signal strength 1 of 5

According to the chart of M5, AUDUSD formed the Bearish Rectangle which is a pattern of a trend continuation. The pattern is contained within the following borders: lower border 0.6353
The M5 and M15 time frames may have more false entry points.
Open chart in a new window


