

Corak sebenar

Bearish Symmetrical Triangle
was formed on 27.03 at 03:36:21 (UTC+0)
signal strength 1 of 5
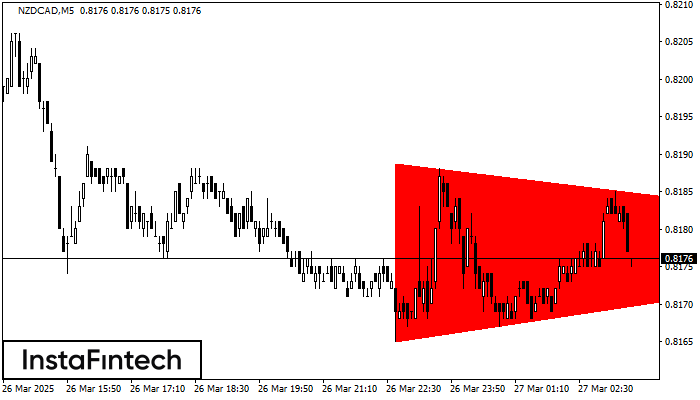
According to the chart of M5, NZDCAD formed the Bearish Symmetrical Triangle pattern. This pattern signals a further downward trend in case the lower border 0.8165 is breached. Here, a hypothetical profit will equal the width of the available pattern that is -24 pips.
The M5 and M15 time frames may have more false entry points.
Juga lihat
- All
- All
- Bearish Rectangle
- Bearish Symmetrical Triangle
- Bearish Symmetrical Triangle
- Bullish Rectangle
- Double Top
- Double Top
- Triple Bottom
- Triple Bottom
- Triple Top
- Triple Top
- All
- All
- Buy
- Sale
- All
- 1
- 2
- 3
- 4
- 5
Double Top
сформирован 14.04 в 14:05:46 (UTC+0)
сила сигнала 1 из 5
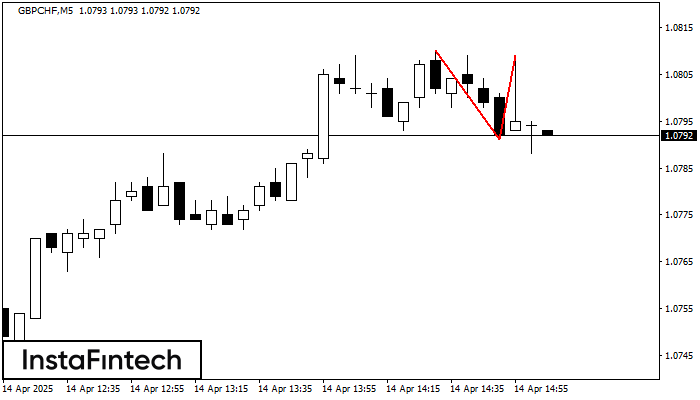
The Double Top reversal pattern has been formed on GBPCHF M5. Characteristics: the upper boundary 1.0810; the lower boundary 1.0791; the width of the pattern is 18 points. Sell trades
The M5 and M15 time frames may have more false entry points.
Открыть график инструмента в новом окне
Bullish Rectangle
сформирован 14.04 в 13:57:45 (UTC+0)
сила сигнала 1 из 5
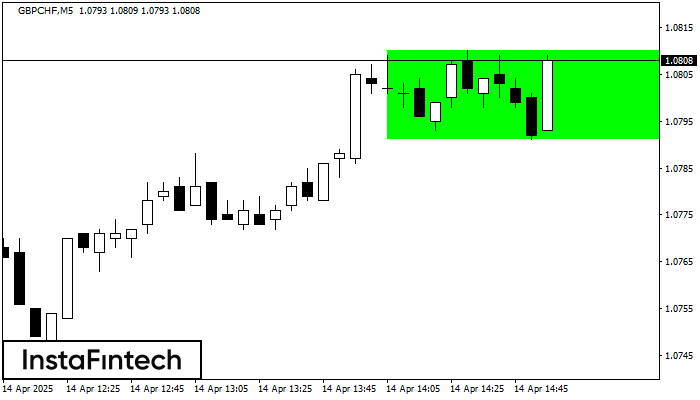
According to the chart of M5, GBPCHF formed the Bullish Rectangle. The pattern indicates a trend continuation. The upper border is 1.0810, the lower border is 1.0791. The signal means
The M5 and M15 time frames may have more false entry points.
Открыть график инструмента в новом окне
Triple Top
сформирован 14.04 в 13:55:08 (UTC+0)
сила сигнала 1 из 5
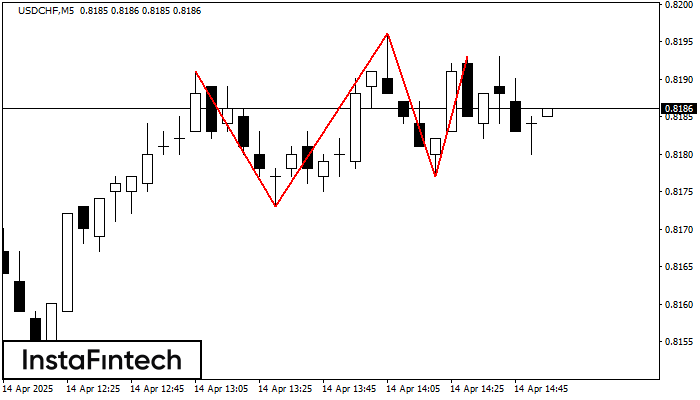
The Triple Top pattern has formed on the chart of the USDCHF M5 trading instrument. It is a reversal pattern featuring the following characteristics: resistance level -2, support level -4
The M5 and M15 time frames may have more false entry points.
Открыть график инструмента в новом окне


