

Corak sebenar

Bullish Symmetrical Triangle
was formed on 27.03 at 01:21:01 (UTC+0)
signal strength 1 of 5
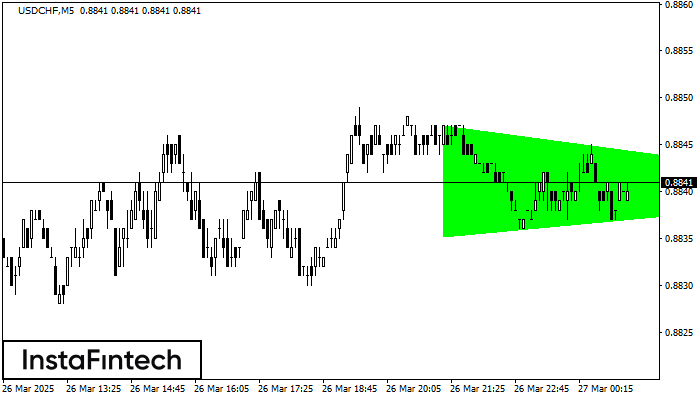
According to the chart of M5, USDCHF formed the Bullish Symmetrical Triangle pattern. Description: This is the pattern of a trend continuation. 0.8847 and 0.8835 are the coordinates of the upper and lower borders respectively. The pattern width is measured on the chart at 12 pips. Outlook: If the upper border 0.8847 is broken, the price is likely to continue its move by 0.8855.
The M5 and M15 time frames may have more false entry points.
- All
- All
- Bearish Rectangle
- Bearish Symmetrical Triangle
- Bearish Symmetrical Triangle
- Bullish Rectangle
- Double Top
- Double Top
- Triple Bottom
- Triple Bottom
- Triple Top
- Triple Top
- All
- All
- Buy
- Sale
- All
- 1
- 2
- 3
- 4
- 5
Double Bottom
was formed on 31.05 at 13:20:01 (UTC+0)
signal strength 1 of 5

Corak Double Bottom telah dibentuk pada #Bitcoin M5. Ciri-ciri: tahap sokongan 103250.25; tahap rintangan 103385.09; lebar corak 13484 mata. Sekiranya tahap rintangan ditembusi, perubahan aliran boleh diramalkan dengan titik sasaran
Carta masa M5 dan M15 mungkin mempunyai lebih banyak titik kemasukan palsu.
Open chart in a new window
Triple Top
was formed on 30.05 at 22:20:23 (UTC+0)
signal strength 1 of 5

Corak Triple Top telah dibentuk pada carta bagi instrumen dagangan GOLD M5. Ia adalah corak pembalikan yang memaparkan ciri-ciri berikut: tahap rintangan 4, tahap sokongan -193, dan lebar corak
Carta masa M5 dan M15 mungkin mempunyai lebih banyak titik kemasukan palsu.
Open chart in a new window
Inverse Head dan Shoulder
was formed on 30.05 at 21:50:24 (UTC+0)
signal strength 1 of 5

Berdasarkan carta M5, #AMZN menghasilkan corak yang dinyatakan Inverse Head dan Shoulder. Head telah ditetapkan pada 201.64 manakala garisan median Neck ditetapkan pada 204.52/205.01. Pembentukan Corak Inverse Head dan Shoulder
Carta masa M5 dan M15 mungkin mempunyai lebih banyak titik kemasukan palsu.
Open chart in a new window


