

Corak sebenar

Double Top
was formed on 27.03 at 00:00:20 (UTC+0)
signal strength 5 of 5
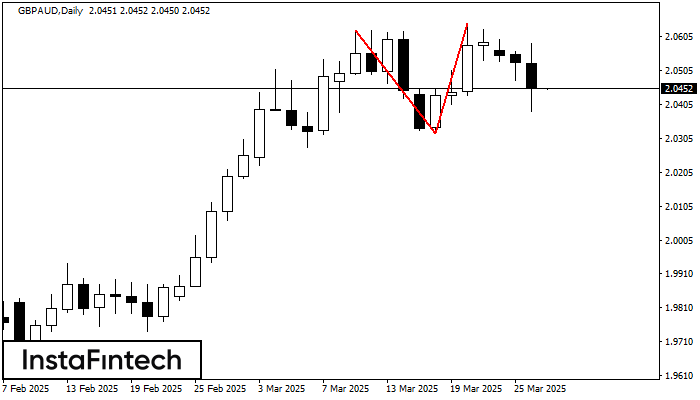
On the chart of GBPAUD D1 the Double Top reversal pattern has been formed. Characteristics: the upper boundary 2.0644; the lower boundary 2.0321; the width of the pattern 323 points. The signal: a break of the lower boundary will cause continuation of the downward trend targeting the 2.0281 level.
Juga lihat
- All
- All
- Bearish Rectangle
- Bearish Symmetrical Triangle
- Bearish Symmetrical Triangle
- Bullish Rectangle
- Double Top
- Double Top
- Triple Bottom
- Triple Bottom
- Triple Top
- Triple Top
- All
- All
- Buy
- Sale
- All
- 1
- 2
- 3
- 4
- 5
Kepala dan Bahu Terbalik
was formed on 05.06 at 21:40:13 (UTC+0)
signal strength 1 of 5

Menurut grafik M5, #MCD menghasilkan pola yang disebut Kepala dan Bahu Terbalik. The Head ditetapkan di 307.79 sementara garis median The Neck ditetapkan di 308.99/309.18. Formasi Pola Kepala dan Bahu
Rangka waktu M5 dan M15 mungkin memiliki lebih dari titik entri yang keliru.
Open chart in a new window
Segitiga Simetris Bearish
was formed on 05.06 at 21:16:00 (UTC+0)
signal strength 1 of 5

Menurut Grafik dari M5, #NTDOY dibentuk pola Segitiga Simetris Bearish. Deskripsi: Batas yang lebih rendah adalah 20.47/20.60 dan batas atas adalah 20.74/20.60. Lebar pola diukur dalam grafik di -27 pips
Rangka waktu M5 dan M15 mungkin memiliki lebih dari titik entri yang keliru.
Open chart in a new window
Segitiga Simetris Bearish
was formed on 05.06 at 21:15:52 (UTC+0)
signal strength 1 of 5
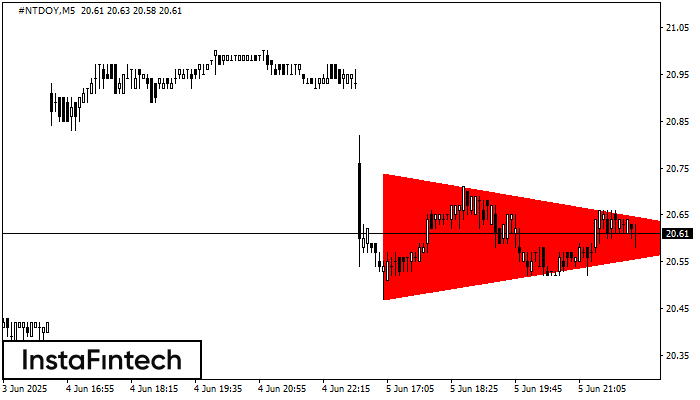
Menurut Grafik dari M5, #NTDOY dibentuk pola Segitiga Simetris Bearish. Rekomendasi Trading: Penembusan dari batas yang lebih rendah 20.47 kemungkinan akan mendorong kelanjutan dari tren penurunan
Rangka waktu M5 dan M15 mungkin memiliki lebih dari titik entri yang keliru.
Open chart in a new window


