

Corak sebenar

Bullish Symmetrical Triangle
was formed on 19.03 at 18:02:02 (UTC+0)
signal strength 3 of 5
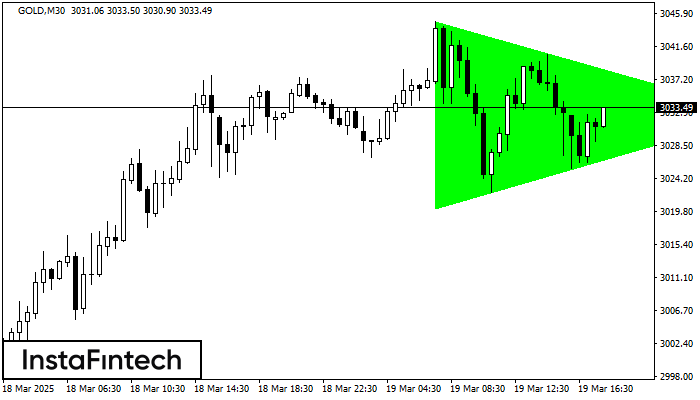
According to the chart of M30, GOLD formed the Bullish Symmetrical Triangle pattern, which signals the trend will continue. Description. The upper border of the pattern touches the coordinates 3044.87/3032.56 whereas the lower border goes across 3020.18/3032.56. The pattern width is measured on the chart at 2469 pips. If the Bullish Symmetrical Triangle pattern is in progress during the upward trend, this indicates the current trend will go on. In case 3032.56 is broken, the price could continue its move toward 3032.86.
- All
- All
- Bearish Rectangle
- Bearish Symmetrical Triangle
- Bearish Symmetrical Triangle
- Bullish Rectangle
- Double Top
- Double Top
- Triple Bottom
- Triple Bottom
- Triple Top
- Triple Top
- All
- All
- Buy
- Sale
- All
- 1
- 2
- 3
- 4
- 5
Double Top
was formed on 06.06 at 22:30:10 (UTC+0)
signal strength 2 of 5

Pada carta USDCAD M15 corak pembalikan Double Top telah terbentuk. Ciri-ciri: sempadan atas 1.3702; sempadan bawah 1.3668; lebar corak 34 mata. Isyarat: penembusan sempadan bawah akan menyebabkan kesinambungan arah aliran
Carta masa M5 dan M15 mungkin mempunyai lebih banyak titik kemasukan palsu.
Open chart in a new window
Segi Tiga Simetri Menaik
was formed on 06.06 at 22:18:11 (UTC+0)
signal strength 2 of 5

Berdasarkan carta M15, AUDJPY membentuk corak Segi Tiga Simetri Menaik. Sempadan yang lebih rendah bagi corak yang menyentuh koordinat 93.96/94.02 di mana sempadan atas merentasi 94.07/94.02. Sekiranya corak Segi Tiga
Carta masa M5 dan M15 mungkin mempunyai lebih banyak titik kemasukan palsu.
Open chart in a new window
Triple Bottom
was formed on 06.06 at 22:01:08 (UTC+0)
signal strength 3 of 5

Corak Triple Bottom telah dibentuk pada carta bagi instrumen dagangan GBPAUD M30. Corak menandakan perubahan aliran dari menurun ke aliran menaik dalam sekiranya penembusan 2.0879/2.0852
Open chart in a new window

