

Corak sebenar

Bullish Flag
was formed on 05.03 at 13:00:39 (UTC+0)
signal strength 3 of 5
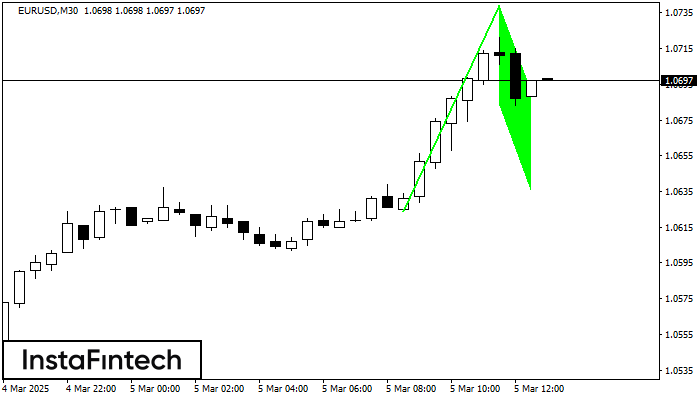
The Bullish Flag pattern has been formed on EURUSD at M30. The lower boundary of the pattern is located at 1.0683/1.0635, while the higher boundary lies at 1.0739/1.0691. The projection of the flagpole is 115 points. This formation signals that the upward trend is most likely to continue. Therefore, if the level of 1.0739 is broken, the price will move further upwards.
- All
- All
- Bearish Rectangle
- Bearish Symmetrical Triangle
- Bearish Symmetrical Triangle
- Bullish Rectangle
- Double Top
- Double Top
- Triple Bottom
- Triple Bottom
- Triple Top
- Triple Top
- All
- All
- Buy
- Sale
- All
- 1
- 2
- 3
- 4
- 5
Double Top
was formed on 28.05 at 21:00:23 (UTC+0)
signal strength 3 of 5
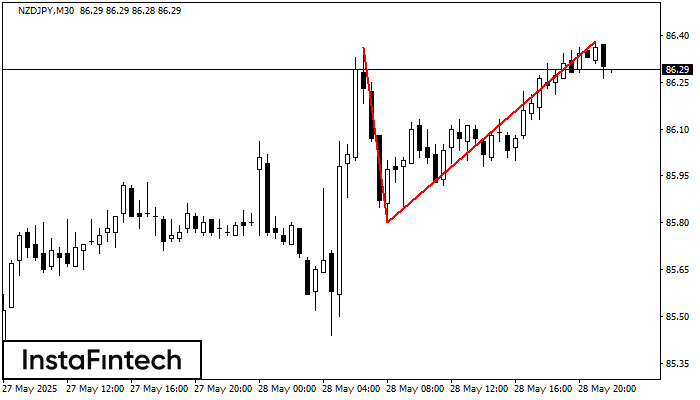
Pada carta NZDJPY M30 corak pembalikan Double Top telah terbentuk. Ciri-ciri: sempadan atas 86.38; sempadan bawah 85.80; lebar corak 58 mata. Isyarat: penembusan sempadan bawah akan menyebabkan kesinambungan arah aliran
Open chart in a new window
Double Bottom
was formed on 28.05 at 20:55:28 (UTC+0)
signal strength 1 of 5
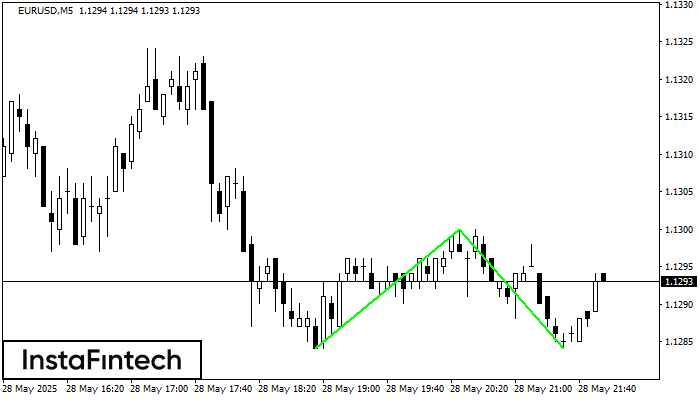
Corak Double Bottom telah dibentuk pada EURUSD M5. Ciri-ciri: tahap sokongan 1.1284; tahap rintangan 1.1300; lebar corak 16 mata. Sekiranya tahap rintangan ditembusi, perubahan aliran boleh diramalkan dengan titik sasaran
Carta masa M5 dan M15 mungkin mempunyai lebih banyak titik kemasukan palsu.
Open chart in a new window
Head dan Shoulders
was formed on 28.05 at 20:45:31 (UTC+0)
signal strength 1 of 5
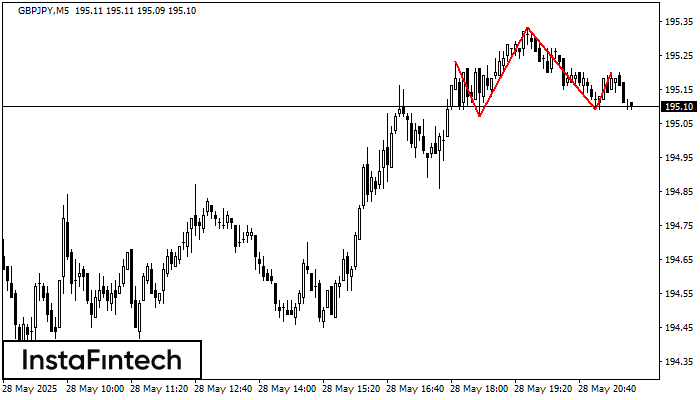
Berdasarkan M5, GBPJPY membentuk corak Head dan Shoulders. Bahagian atas Head ditetapkan pada 195.33 manakala garisan median Neck akan ditetapkan pada 195.07/195.09. Pembentukan corak Head dan Shoulders jelas menandakan pembalikan
Carta masa M5 dan M15 mungkin mempunyai lebih banyak titik kemasukan palsu.
Open chart in a new window


