

Өзекті паттерндер

Прямоугольник
сформирован 28.04 в 03:46:06 (UTC+0)
сила сигнала 1 из 5
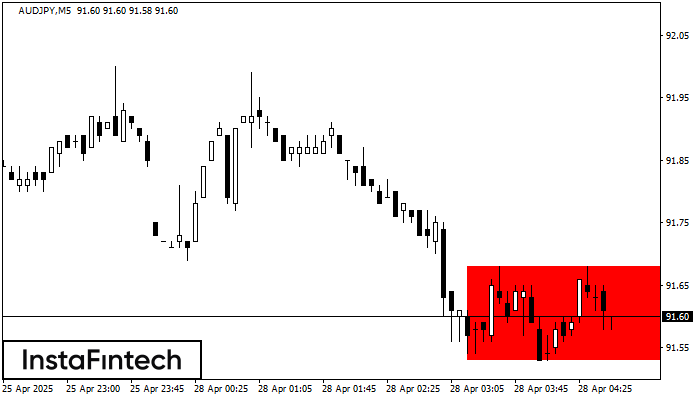
По AUDJPY M5 сформировалась фигура - «Прямоугольник». Фигура данного типа относится к тому типу продолжения тренда, который имеет два уровня: Сопротивление 91.68; Поддержка 91.53. В случае пробоя уровня поддержки 91.53 возможно дальнейшее нисходящее движение.
Таймфреймы М5 и М15 могут иметь больше ложных точек входа.
Сондай-ақ қараңыз
- Все
- Все
- Bearish Rectangle
- Bearish Symmetrical Triangle
- Bearish Symmetrical Triangle
- Bullish Rectangle
- Double Top
- Double Top
- Triple Bottom
- Triple Bottom
- Triple Top
- Triple Top
- Все
- Все
- Покупка
- Продажа
- Все
- 1
- 2
- 3
- 4
- 5
Double Top
was formed on 27.05 at 18:55:14 (UTC+0)
signal strength 1 of 5
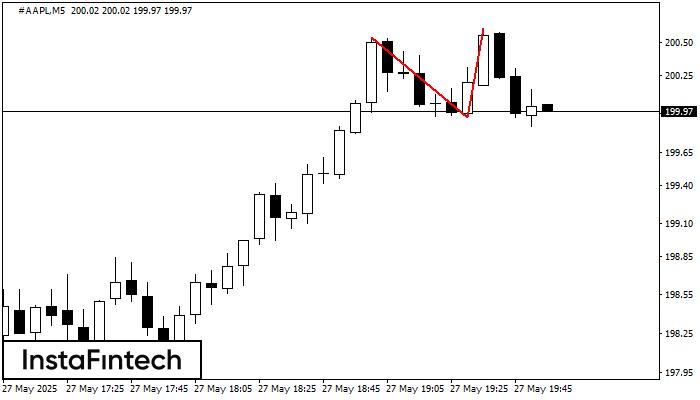
The Double Top reversal pattern has been formed on #AAPL M5. Characteristics: the upper boundary 200.54; the lower boundary 199.92; the width of the pattern is 69 points. Sell trades
The M5 and M15 time frames may have more false entry points.
Open chart in a new window
Double Bottom
was formed on 27.05 at 18:40:16 (UTC+0)
signal strength 1 of 5
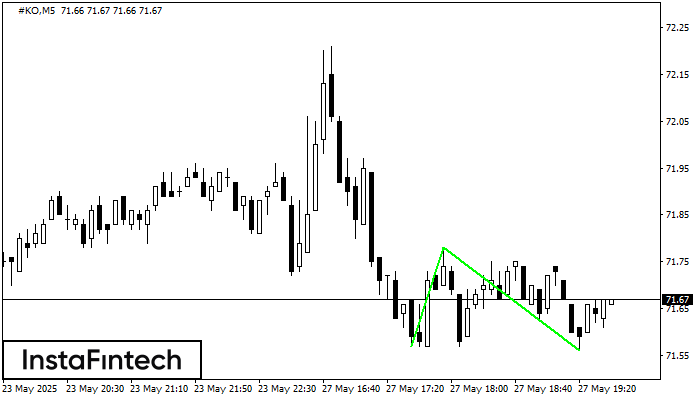
The Double Bottom pattern has been formed on #KO M5. Characteristics: the support level 71.57; the resistance level 71.78; the width of the pattern 21 points. If the resistance level
The M5 and M15 time frames may have more false entry points.
Open chart in a new window
Triple Bottom
was formed on 27.05 at 18:30:14 (UTC+0)
signal strength 2 of 5
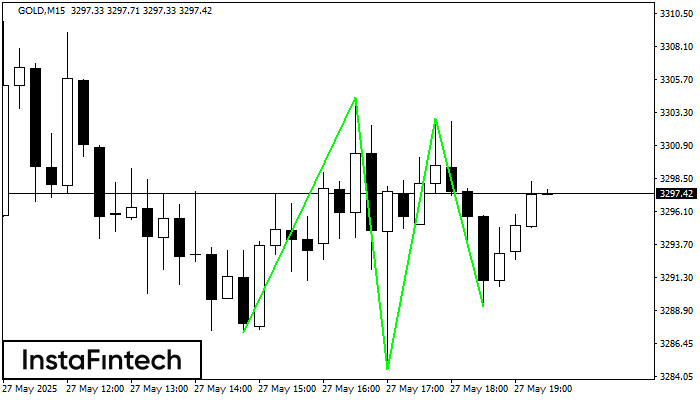
The Triple Bottom pattern has formed on the chart of the GOLD M15 trading instrument. The pattern signals a change in the trend from downwards to upwards in the case
The M5 and M15 time frames may have more false entry points.
Open chart in a new window


