

Өзекті паттерндер

Двойная вершина
сформирован 25.04 в 22:00:30 (UTC+0)
сила сигнала 4 из 5

На торговом графике EURNZD H1 сформировалась разворотная фигура «Двойная вершина». Характеристика: Верхняя граница 1.9079; Нижняя граница 1.9023; Ширина фигуры 56 пунктов. Сигнал: Пробой нижней границы 1.9023 приведет к дальнейшему нисходящему движению с перспективой хода к уровню 1.8983.
- Все
- Все
- Bearish Rectangle
- Bearish Symmetrical Triangle
- Bearish Symmetrical Triangle
- Bullish Rectangle
- Double Top
- Double Top
- Triple Bottom
- Triple Bottom
- Triple Top
- Triple Top
- Все
- Все
- Покупка
- Продажа
- Все
- 1
- 2
- 3
- 4
- 5
Double Top
сформирован 29.05 в 13:09:57 (UTC+0)
сила сигнала 1 из 5
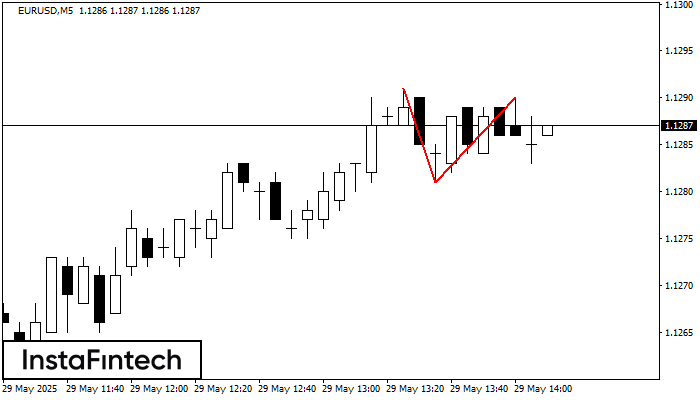
The Double Top reversal pattern has been formed on EURUSD M5. Characteristics: the upper boundary 1.1291; the lower boundary 1.1281; the width of the pattern is 9 points. Sell trades
The M5 and M15 time frames may have more false entry points.
Открыть график инструмента в новом окне
Double Bottom
сформирован 29.05 в 12:59:54 (UTC+0)
сила сигнала 2 из 5
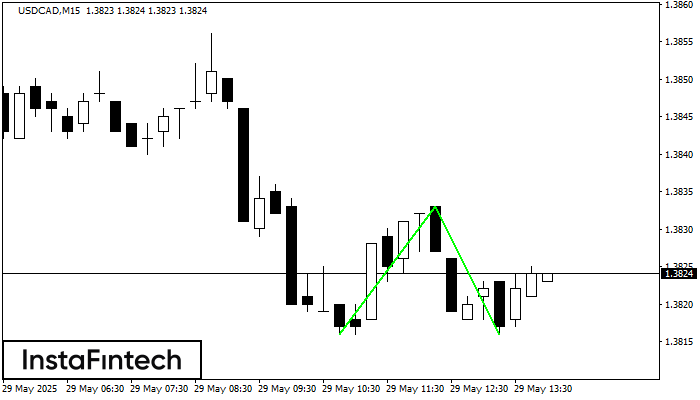
The Double Bottom pattern has been formed on USDCAD M15. This formation signals a reversal of the trend from downwards to upwards. The signal is that a buy trade should
The M5 and M15 time frames may have more false entry points.
Открыть график инструмента в новом окне
Triple Bottom
сформирован 29.05 в 12:44:43 (UTC+0)
сила сигнала 1 из 5
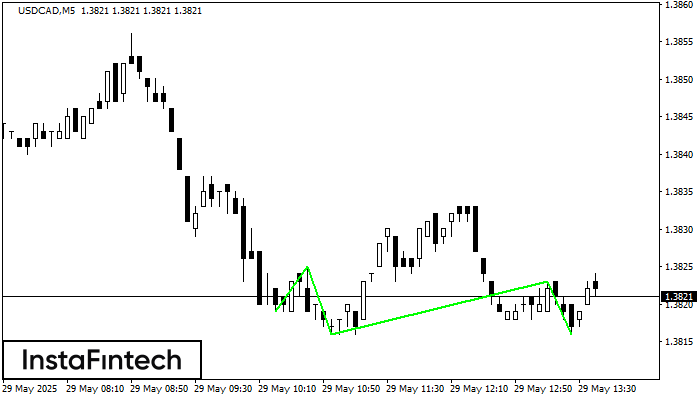
The Triple Bottom pattern has formed on the chart of USDCAD M5. Features of the pattern: The lower line of the pattern has coordinates 1.3825 with the upper limit 1.3825/1.3823
The M5 and M15 time frames may have more false entry points.
Открыть график инструмента в новом окне


