

Өзекті паттерндер

Медвежий симметричный треугольник
сформирован 24.04 в 21:08:21 (UTC+0)
сила сигнала 4 из 5
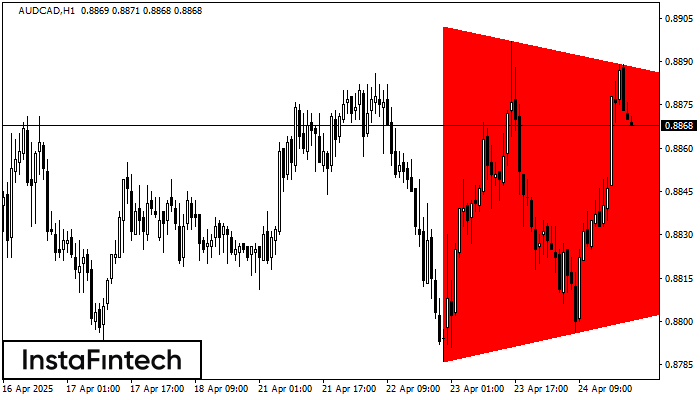
На графике AUDCAD на H1 сформировалась фигура «Медвежий симметричный треугольник». Торговые рекомендации: Пробой нижней границы 0.8786 с большой долей вероятности приведет к продолжению нисходящего тренда.
- Все
- Все
- Bearish Rectangle
- Bearish Symmetrical Triangle
- Bearish Symmetrical Triangle
- Bullish Rectangle
- Double Top
- Double Top
- Triple Bottom
- Triple Bottom
- Triple Top
- Triple Top
- Все
- Все
- Покупка
- Продажа
- Все
- 1
- 2
- 3
- 4
- 5
Double Top
was formed on 30.05 at 14:15:38 (UTC+0)
signal strength 2 of 5
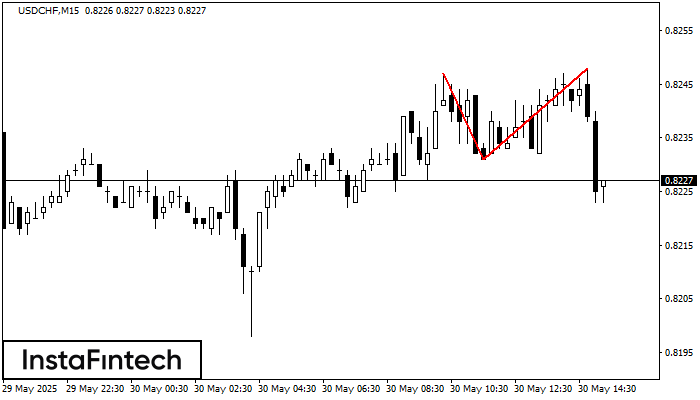
Corak pembalikan Double Top telah dibentuk pada USDCHF M15. Ciri-ciri: sempadan atas %P0.000000; sempadan bawah 0.8247; sempadan bawah 0.8231; lebar corak adalah 17 mata. Dagangan menjual adalah lebih baik untuk
Carta masa M5 dan M15 mungkin mempunyai lebih banyak titik kemasukan palsu.
Open chart in a new window
Double Top
was formed on 30.05 at 14:10:05 (UTC+0)
signal strength 1 of 5
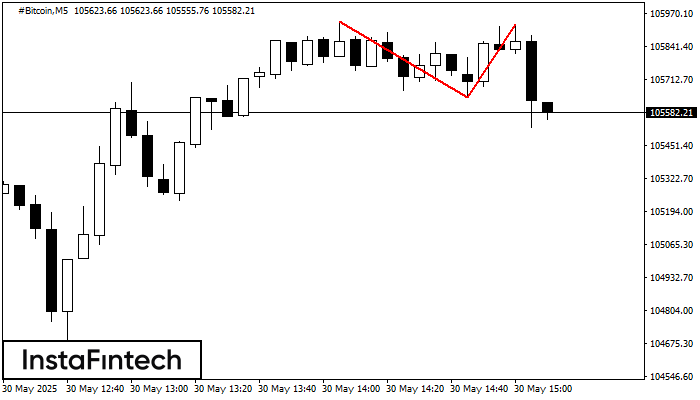
Corak Double Top telah dibentuk pada #Bitcoin M5. Isyarat bahawa aliran telah berubah dari aliran menaik ke aliran menurun. Mungkin, sekiranya asas corak 105641.82 ditembusi, pergerakan menurun akan berterusan
Carta masa M5 dan M15 mungkin mempunyai lebih banyak titik kemasukan palsu.
Open chart in a new window
Double Bottom
was formed on 30.05 at 14:00:56 (UTC+0)
signal strength 4 of 5
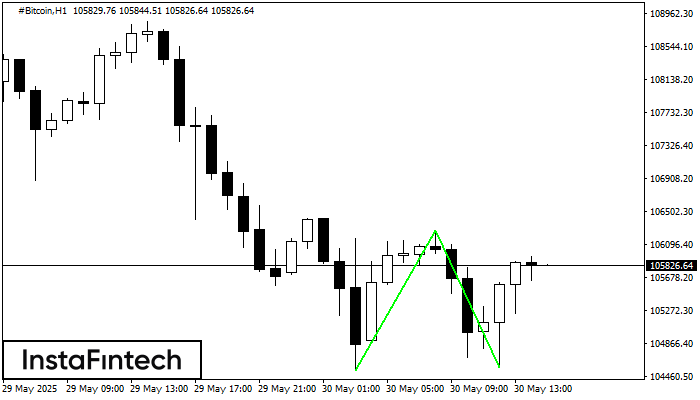
Corak Double Bottom telah dibentuk pada #Bitcoin H1; sempadan atas adalah 106265.19; sempadan bawah adalah 104569.21. Lebar corak adalah 173331 mata. Sekiranya penembusan sempadan atas 106265.19, perubahan aliran boleh diramalkan
Open chart in a new window


