

Өзекті паттерндер

Тройная вершина
сформирован 24.04 в 19:10:57 (UTC+0)
сила сигнала 1 из 5
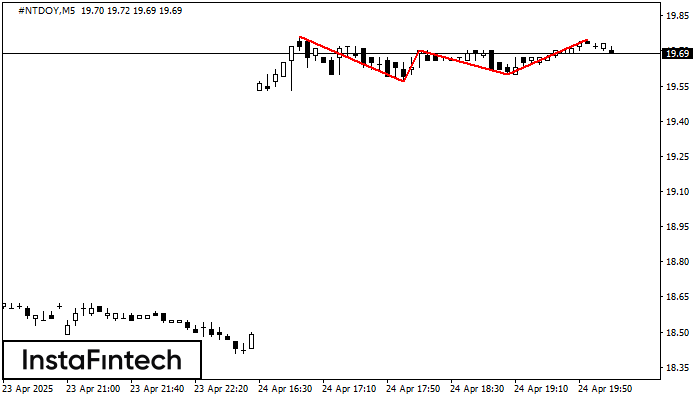
На графике #NTDOY M5 образовалась фигура «Тройная вершина». Данная фигура относится к типу разворотных и имеет характеристику: Верхняя граница 19.76/19.75; Нижняя граница 19.57/19.60; Ширина фигуры 10 пунктов. Прогноз: В случае пробоя нижней границы 19.57 вероятно дальнейшее нисходящее движение к уровню 19.55.
Таймфреймы М5 и М15 могут иметь больше ложных точек входа.
- Все
- Все
- Bearish Rectangle
- Bearish Symmetrical Triangle
- Bearish Symmetrical Triangle
- Bullish Rectangle
- Double Top
- Double Top
- Triple Bottom
- Triple Bottom
- Triple Top
- Triple Top
- Все
- Все
- Покупка
- Продажа
- Все
- 1
- 2
- 3
- 4
- 5
Bullish Rectangle
was formed on 02.06 at 17:50:31 (UTC+0)
signal strength 1 of 5
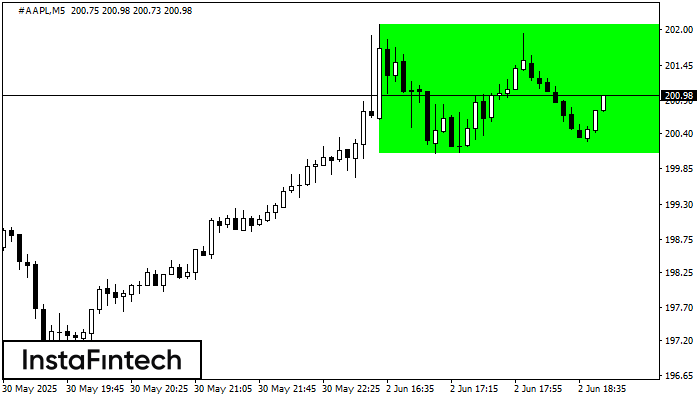
According to the chart of M5, #AAPL formed the Bullish Rectangle. The pattern indicates a trend continuation. The upper border is 202.09, the lower border is 200.08. The signal means
The M5 and M15 time frames may have more false entry points.
Open chart in a new window
Double Top
was formed on 02.06 at 17:30:00 (UTC+0)
signal strength 1 of 5
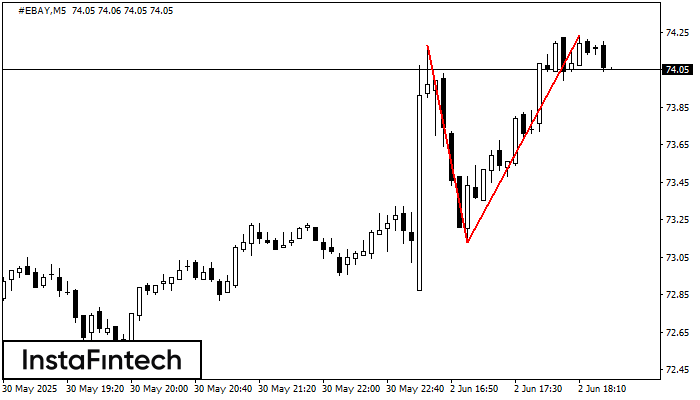
On the chart of #EBAY M5 the Double Top reversal pattern has been formed. Characteristics: the upper boundary 74.23; the lower boundary 73.13; the width of the pattern 110 points
The M5 and M15 time frames may have more false entry points.
Open chart in a new window
Bearish pennant
was formed on 02.06 at 17:29:49 (UTC+0)
signal strength 2 of 5
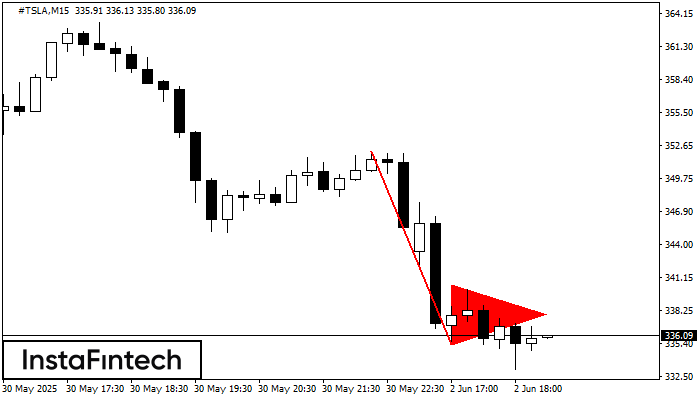
The Bearish pennant pattern has formed on the #TSLA M15 chart. This pattern type is characterized by a slight slowdown after which the price will move in the direction
The M5 and M15 time frames may have more false entry points.
Open chart in a new window


