

Өзекті паттерндер

Двойная вершина
сформирован 24.04 в 17:35:22 (UTC+0)
сила сигнала 1 из 5
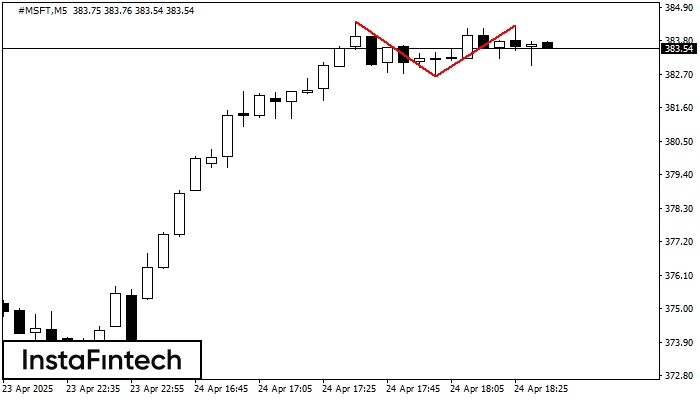
По торговому инструменту #MSFT на M5 сформировалась фигура «Двойная вершина», которая сигнализирует нам об изменении тенденции с восходящей на нисходящую. Вероятно, что, в случае пробоя основания фигуры 382.62, возможно дальнейшее нисходящее движение.
Таймфреймы М5 и М15 могут иметь больше ложных точек входа.
Сондай-ақ қараңыз
- Все
- Все
- Bearish Rectangle
- Bearish Symmetrical Triangle
- Bearish Symmetrical Triangle
- Bullish Rectangle
- Double Top
- Double Top
- Triple Bottom
- Triple Bottom
- Triple Top
- Triple Top
- Все
- Все
- Покупка
- Продажа
- Все
- 1
- 2
- 3
- 4
- 5
Тройная вершина
сформирован 01.06 в 02:15:04 (UTC+0)
сила сигнала 2 из 5

На графике #Bitcoin M15 образовалась фигура «Тройная вершина». Данная фигура относится к типу разворотных и имеет характеристику: Верхняя граница 104800.13/104799.73; Нижняя граница 104215.56/104423.26; Ширина фигуры 43254 пунктов. Прогноз: В случае
Таймфреймы М5 и М15 могут иметь больше ложных точек входа.
Открыть график инструмента в новом окне
Двойная вершина
сформирован 01.06 в 01:00:35 (UTC+0)
сила сигнала 3 из 5

По #Bitcoin на M30 сформировалась разворотная фигура «Двойная вершина». Характеристика: Верхняя граница 104800.13; Нижняя граница 104215.56; Ширина фигуры 64024 пунктов. Позицию на продажу возможно открыть ниже нижней границы 104215.56
Открыть график инструмента в новом окне
Прямоугольник
сформирован 31.05 в 19:15:46 (UTC+0)
сила сигнала 1 из 5

По торговому инструменту #Bitcoin на M5 сформировалась фигура продолжения тренда - «Прямоугольник». Фигура имеет границы: Нижняя 104335.43; Верхняя 104800.13. В случае пробоя верхней границы вероятно дальнейшее движение в сторону тренда
Таймфреймы М5 и М15 могут иметь больше ложных точек входа.
Открыть график инструмента в новом окне


