

Өзекті паттерндер

Двойная вершина
сформирован 24.04 в 11:40:32 (UTC+0)
сила сигнала 1 из 5
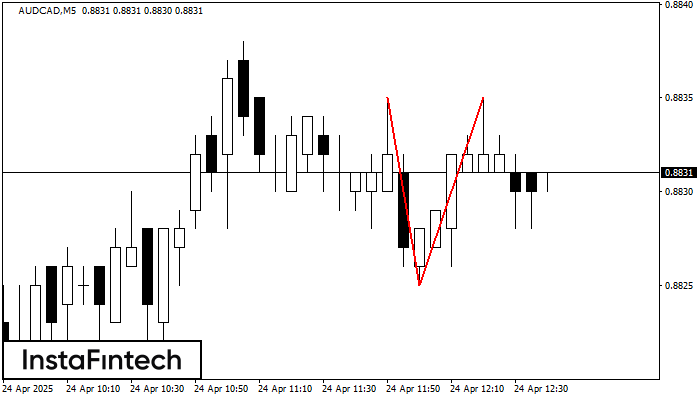
На торговом графике AUDCAD M5 сформировалась разворотная фигура «Двойная вершина». Характеристика: Верхняя граница 0.8835; Нижняя граница 0.8825; Ширина фигуры 10 пунктов. Сигнал: Пробой нижней границы 0.8825 приведет к дальнейшему нисходящему движению с перспективой хода к уровню 0.8810.
Таймфреймы М5 и М15 могут иметь больше ложных точек входа.
- Все
- Все
- Bearish Rectangle
- Bearish Symmetrical Triangle
- Bearish Symmetrical Triangle
- Bullish Rectangle
- Double Top
- Double Top
- Triple Bottom
- Triple Bottom
- Triple Top
- Triple Top
- Все
- Все
- Покупка
- Продажа
- Все
- 1
- 2
- 3
- 4
- 5
Double Top
was formed on 05.06 at 11:15:36 (UTC+0)
signal strength 1 of 5
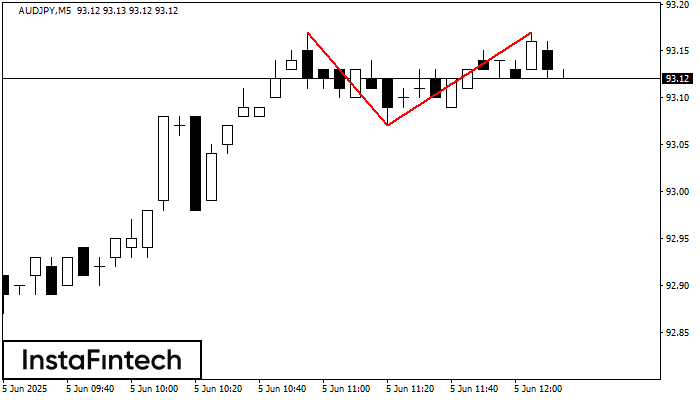
On the chart of AUDJPY M5 the Double Top reversal pattern has been formed. Characteristics: the upper boundary 93.17; the lower boundary 93.07; the width of the pattern 10 points
The M5 and M15 time frames may have more false entry points.
Open chart in a new window
Bearish Symmetrical Triangle
was formed on 05.06 at 10:19:16 (UTC+0)
signal strength 1 of 5
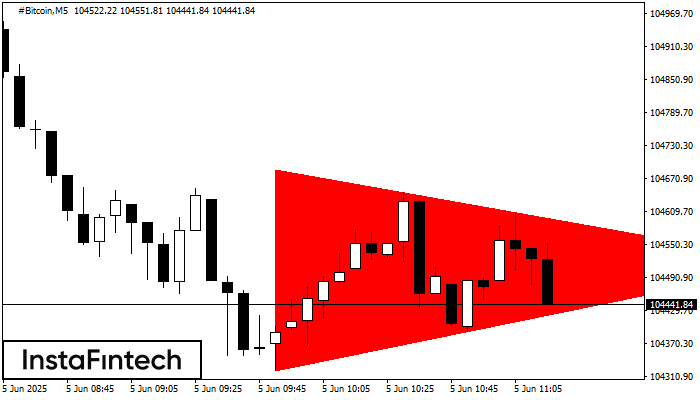
According to the chart of M5, #Bitcoin formed the Bearish Symmetrical Triangle pattern. This pattern signals a further downward trend in case the lower border 104321.45 is breached. Here
The M5 and M15 time frames may have more false entry points.
Open chart in a new window
Bullish Symmetrical Triangle
was formed on 05.06 at 09:01:33 (UTC+0)
signal strength 1 of 5

According to the chart of M5, SILVER formed the Bullish Symmetrical Triangle pattern. The lower border of the pattern touches the coordinates 34.35/34.45 whereas the upper border goes across 34.55/34.45
The M5 and M15 time frames may have more false entry points.
Open chart in a new window


