

Өзекті паттерндер

Тройная вершина
сформирован 17.04 в 17:45:29 (UTC+0)
сила сигнала 1 из 5

На графике NZDCAD M5 образовалась фигура «Тройная вершина». Данная фигура относится к типу разворотных и имеет характеристику: Верхняя граница 0.8272/0.8273; Нижняя граница 0.8255/0.8261; Ширина фигуры 10 пунктов. Прогноз: В случае пробоя нижней границы 0.8255 вероятно дальнейшее нисходящее движение к уровню 0.8256.
Таймфреймы М5 и М15 могут иметь больше ложных точек входа.
Сондай-ақ қараңыз
- Все
- Все
- Bearish Rectangle
- Bearish Symmetrical Triangle
- Bearish Symmetrical Triangle
- Bullish Rectangle
- Double Top
- Double Top
- Triple Bottom
- Triple Bottom
- Triple Top
- Triple Top
- Все
- Все
- Покупка
- Продажа
- Все
- 1
- 2
- 3
- 4
- 5
Bullish Symmetrical Triangle
сформирован 22.08 в 09:45:52 (UTC+0)
сила сигнала 1 из 5
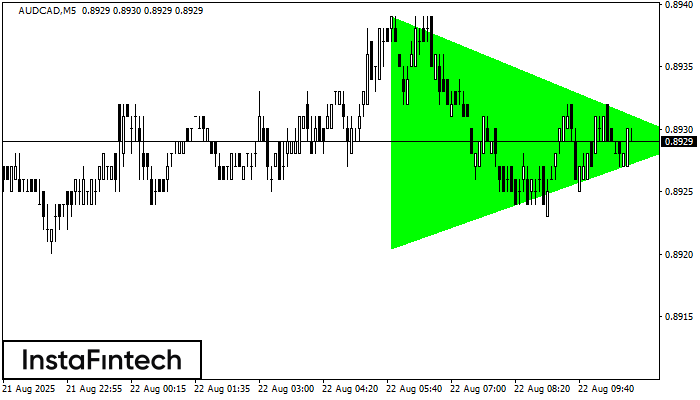
According to the chart of M5, AUDCAD formed the Bullish Symmetrical Triangle pattern. The lower border of the pattern touches the coordinates 0.8920/0.8929 whereas the upper border goes across 0.8939/0.8929
The M5 and M15 time frames may have more false entry points.
Открыть график инструмента в новом окне
Double Top
сформирован 22.08 в 07:30:33 (UTC+0)
сила сигнала 3 из 5
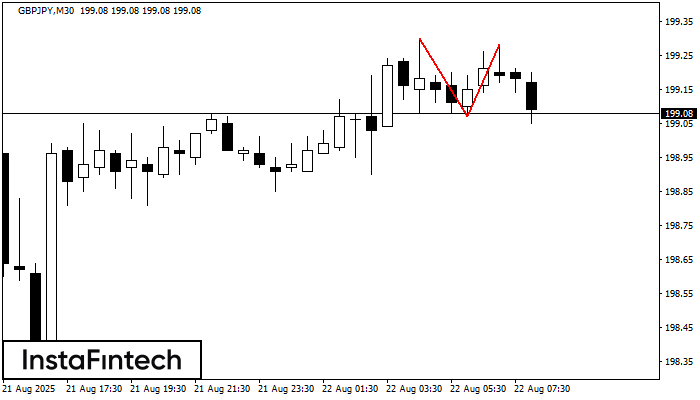
The Double Top reversal pattern has been formed on GBPJPY M30. Characteristics: the upper boundary 199.30; the lower boundary 199.07; the width of the pattern is 21 points. Sell trades
Открыть график инструмента в новом окне
Bearish Rectangle
сформирован 22.08 в 06:30:53 (UTC+0)
сила сигнала 4 из 5
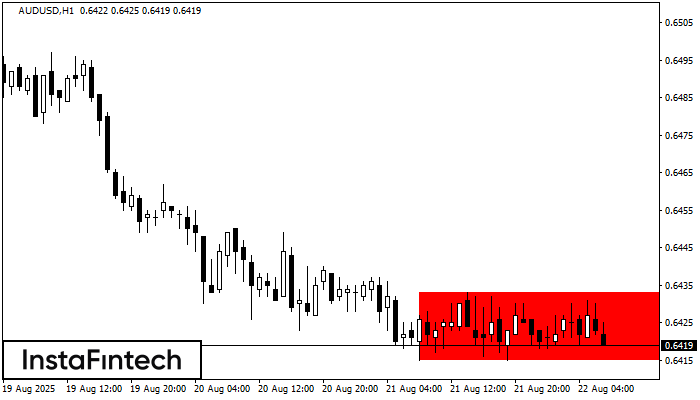
According to the chart of H1, AUDUSD formed the Bearish Rectangle. The pattern indicates a trend continuation. The upper border is 0.6433, the lower border is 0.6415. The signal means
Открыть график инструмента в новом окне


