

Өзекті паттерндер

Двойное дно
сформирован 15.04 в 14:40:16 (UTC+0)
сила сигнала 1 из 5
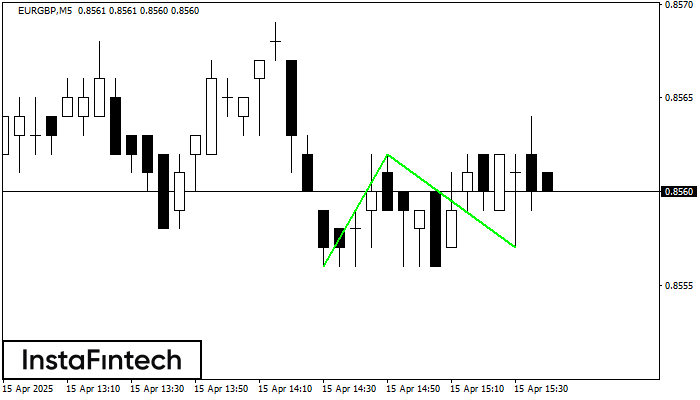
Сформирована фигура «Двойное дно» на графике EURGBP M5. Данное формирование сигнализирует об изменении тенденции с нисходящего на восходящее движение. Сигнал: Торговую позицию на покупку следует открывать после пробоя верхней границы фигуры 0.8562, где перспектива будущего хода будет являться шириной текущей фигуры - 6 пунктов.
Таймфреймы М5 и М15 могут иметь больше ложных точек входа.
Сондай-ақ қараңыз
- Все
- Все
- Bearish Rectangle
- Bearish Symmetrical Triangle
- Bearish Symmetrical Triangle
- Bullish Rectangle
- Double Top
- Double Top
- Triple Bottom
- Triple Bottom
- Triple Top
- Triple Top
- Все
- Все
- Покупка
- Продажа
- Все
- 1
- 2
- 3
- 4
- 5
Double Bottom
сформирован 05.06 в 15:00:20 (UTC+0)
сила сигнала 4 из 5
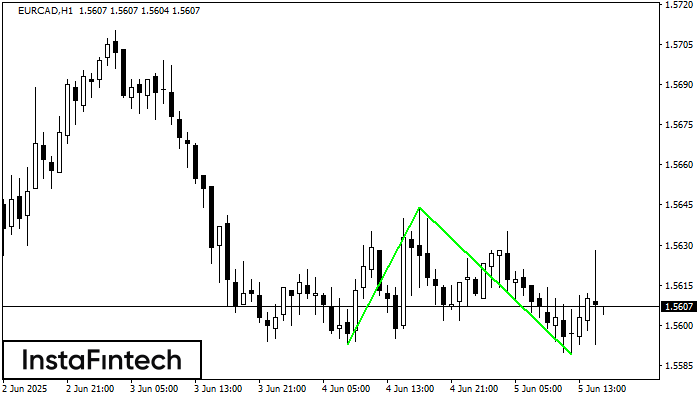
The Double Bottom pattern has been formed on EURCAD H1; the upper boundary is 1.5644; the lower boundary is 1.5589. The width of the pattern is 51 points. In case
Открыть график инструмента в новом окне
Double Top
сформирован 05.06 в 14:30:23 (UTC+0)
сила сигнала 2 из 5
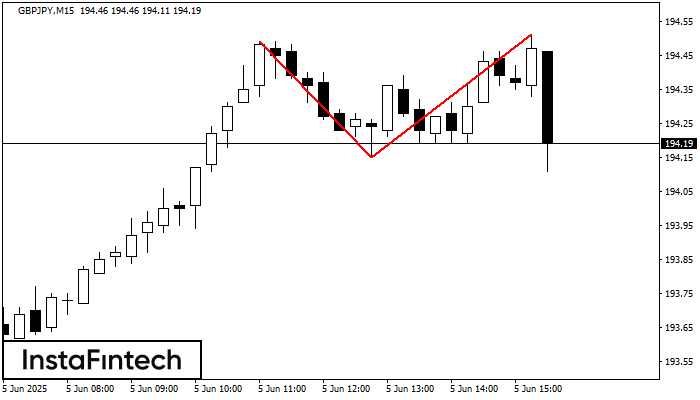
The Double Top reversal pattern has been formed on GBPJPY M15. Characteristics: the upper boundary 194.49; the lower boundary 194.15; the width of the pattern is 36 points. Sell trades
The M5 and M15 time frames may have more false entry points.
Открыть график инструмента в новом окне
Bullish Symmetrical Triangle
сформирован 05.06 в 14:16:35 (UTC+0)
сила сигнала 1 из 5
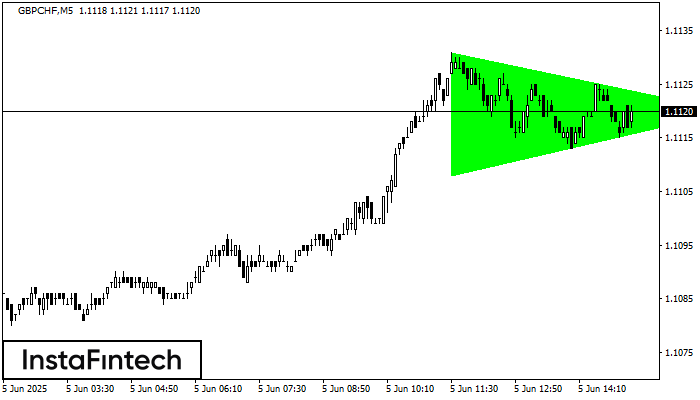
According to the chart of M5, GBPCHF formed the Bullish Symmetrical Triangle pattern. The lower border of the pattern touches the coordinates 1.1108/1.1120 whereas the upper border goes across 1.1131/1.1120
The M5 and M15 time frames may have more false entry points.
Открыть график инструмента в новом окне


