

Өзекті паттерндер

Тройная вершина
сформирован 14.04 в 22:15:55 (UTC+0)
сила сигнала 2 из 5
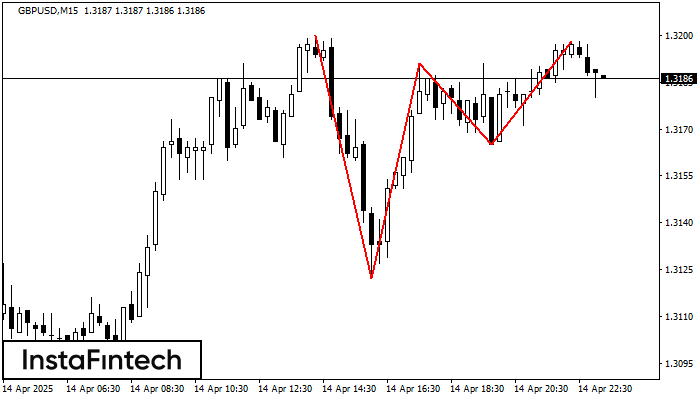
На графике GBPUSD M15 образовалась фигура «Тройная вершина». Данная фигура относится к типу разворотных и имеет характеристику: Верхняя граница 1.3200/1.3198; Нижняя граница 1.3122/1.3165; Ширина фигуры 26 пунктов. Прогноз: В случае пробоя нижней границы 1.3122 вероятно дальнейшее нисходящее движение к уровню 1.3168.
Таймфреймы М5 и М15 могут иметь больше ложных точек входа.
- Все
- Все
- Bearish Rectangle
- Bearish Symmetrical Triangle
- Bearish Symmetrical Triangle
- Bullish Rectangle
- Double Top
- Double Top
- Triple Bottom
- Triple Bottom
- Triple Top
- Triple Top
- Все
- Все
- Покупка
- Продажа
- Все
- 1
- 2
- 3
- 4
- 5
Прямоугольник
сформирован 04.06 в 00:07:32 (UTC+0)
сила сигнала 1 из 5
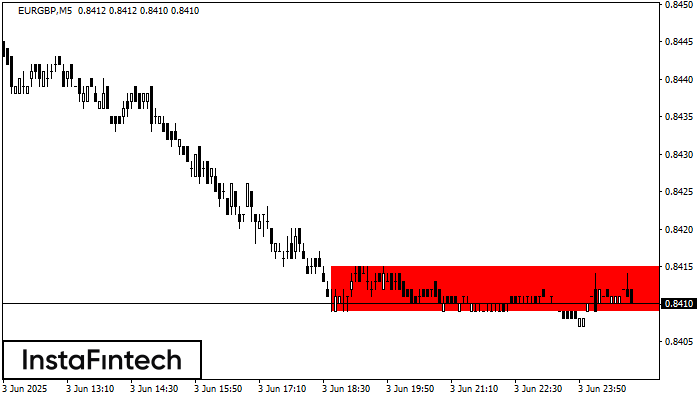
По торговому инструменту EURGBP на M5 сформировалась фигура продолжения тренда - «Прямоугольник». Фигура имеет границы: Нижняя 0.8409; Верхняя 0.8415. В случае пробоя нижней границы вероятно дальнейшее движение в сторону тренда
Таймфреймы М5 и М15 могут иметь больше ложных точек входа.
Открыть график инструмента в новом окне
Прямоугольник
сформирован 03.06 в 23:47:07 (UTC+0)
сила сигнала 1 из 5
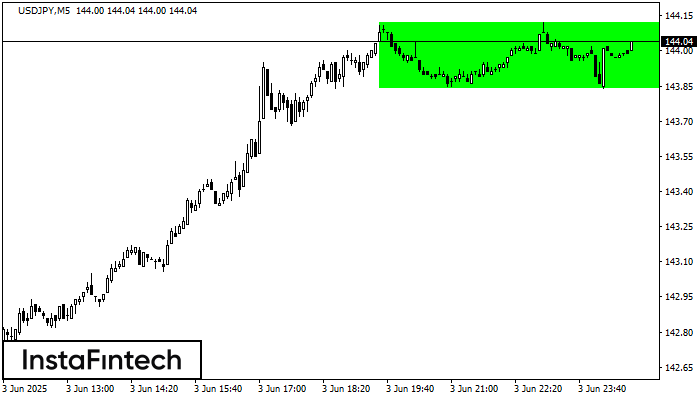
По USDJPY на M5 сформировалась фигура «Прямоугольник». Фигура данного типа относится к тому типу продолжения тренда, который содержит в себе два уровня: Сопротивление 144.12; Поддержка 143.84. В случае пробоя уровня
Таймфреймы М5 и М15 могут иметь больше ложных точек входа.
Открыть график инструмента в новом окне
Прямоугольник
сформирован 03.06 в 23:46:54 (UTC+0)
сила сигнала 2 из 5
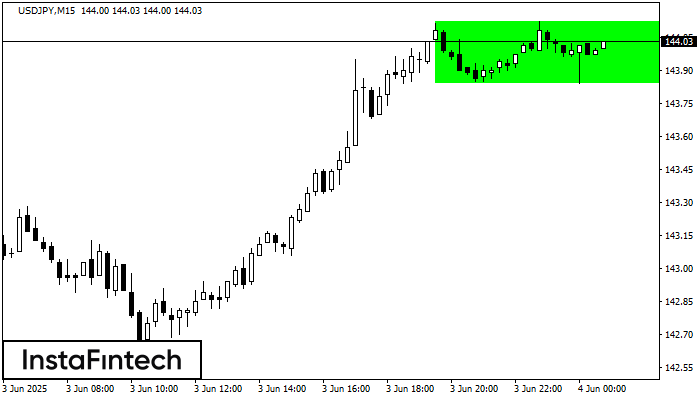
По торговому инструменту USDJPY на M15 сформировалась фигура продолжения тренда - «Прямоугольник». Фигура имеет границы: Нижняя 143.84; Верхняя 144.12. В случае пробоя верхней границы вероятно дальнейшее движение в сторону тренда
Таймфреймы М5 и М15 могут иметь больше ложных точек входа.
Открыть график инструмента в новом окне


