

Өзекті паттерндер

Двойное дно
сформирован 14.04 в 19:00:15 (UTC+0)
сила сигнала 1 из 5
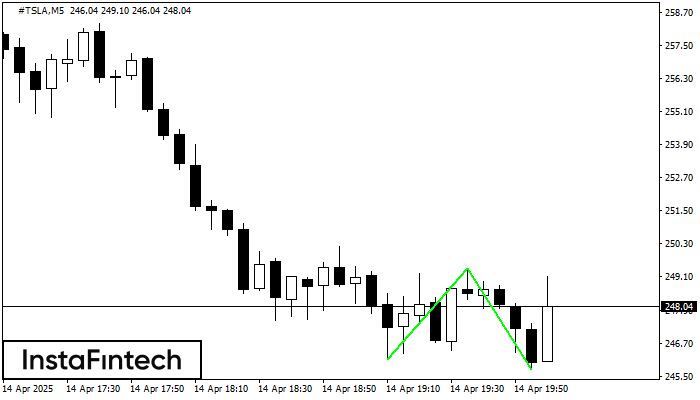
Сформирована фигура «Двойное дно» на графике #TSLA M5. Данное формирование сигнализирует об изменении тенденции с нисходящего на восходящее движение. Сигнал: Торговую позицию на покупку следует открывать после пробоя верхней границы фигуры 249.40, где перспектива будущего хода будет являться шириной текущей фигуры - 329 пунктов.
Таймфреймы М5 и М15 могут иметь больше ложных точек входа.
Сондай-ақ қараңыз
- Все
- Все
- Bearish Rectangle
- Bearish Symmetrical Triangle
- Bearish Symmetrical Triangle
- Bullish Rectangle
- Double Top
- Double Top
- Triple Bottom
- Triple Bottom
- Triple Top
- Triple Top
- Все
- Все
- Покупка
- Продажа
- Все
- 1
- 2
- 3
- 4
- 5
Double Bottom
was formed on 04.06 at 23:40:22 (UTC+0)
signal strength 1 of 5
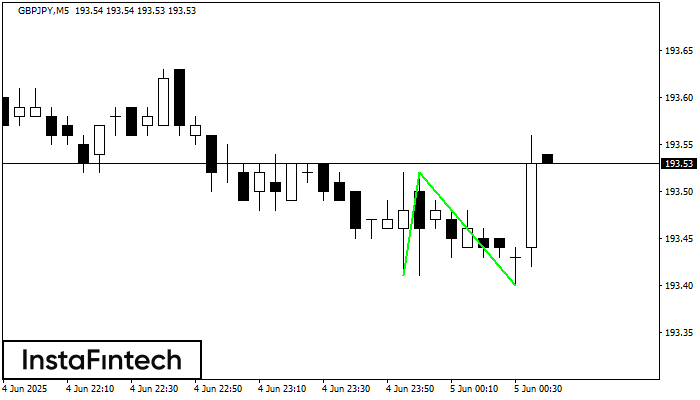
The Double Bottom pattern has been formed on GBPJPY M5. This formation signals a reversal of the trend from downwards to upwards. The signal is that a buy trade should
The M5 and M15 time frames may have more false entry points.
Open chart in a new window
Double Bottom
was formed on 04.06 at 23:15:29 (UTC+0)
signal strength 2 of 5
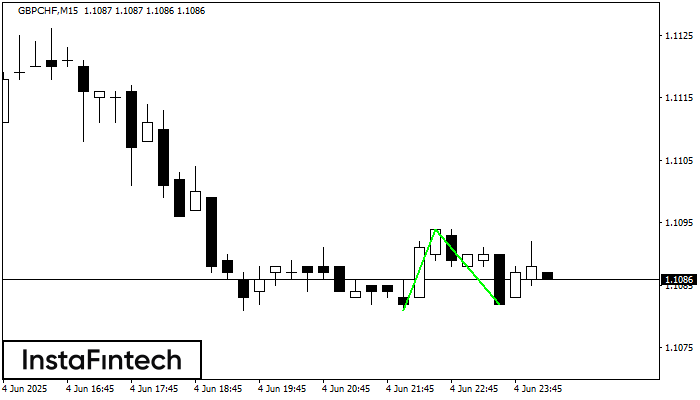
The Double Bottom pattern has been formed on GBPCHF M15. Characteristics: the support level 1.1081; the resistance level 1.1094; the width of the pattern 13 points. If the resistance level
The M5 and M15 time frames may have more false entry points.
Open chart in a new window
Head and Shoulders
was formed on 04.06 at 21:56:17 (UTC+0)
signal strength 1 of 5
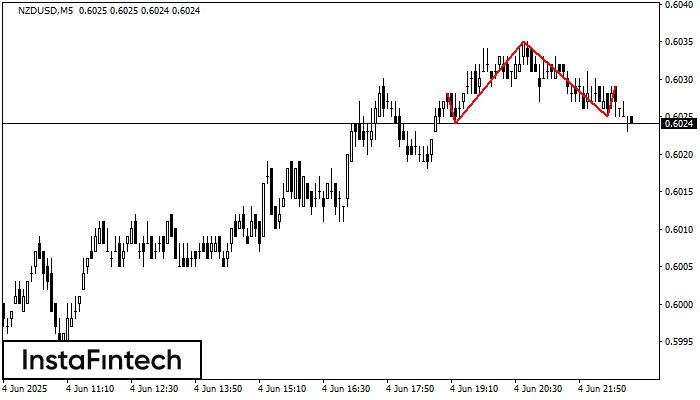
According to the chart of M5, NZDUSD formed the Head and Shoulders pattern. The Head’s top is set at 0.6035 while the median line of the Neck is found
The M5 and M15 time frames may have more false entry points.
Open chart in a new window


