

Өзекті паттерндер

Бычий вымпел
сформирован 14.04 в 16:00:24 (UTC+0)
сила сигнала 1 из 5
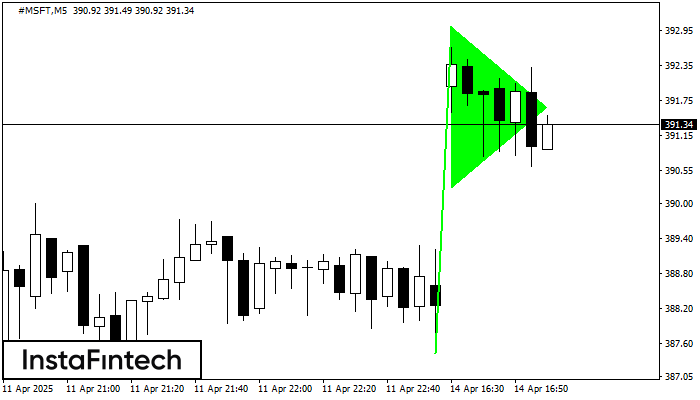
На графике #MSFT M5 сформировался паттерн «Бычий вымпел», который относится к фигуре продолжения тренда. Можно предполагать, что, в случае фиксации цены выше максимума вымпела 393.01, возможно дальнейшее восходящее движение.
Таймфреймы М5 и М15 могут иметь больше ложных точек входа.
Сондай-ақ қараңыз
- Все
- Все
- Bearish Rectangle
- Bearish Symmetrical Triangle
- Bearish Symmetrical Triangle
- Bullish Rectangle
- Double Top
- Double Top
- Triple Bottom
- Triple Bottom
- Triple Top
- Triple Top
- Все
- Все
- Покупка
- Продажа
- Все
- 1
- 2
- 3
- 4
- 5
Triple Bottom
сформирован 13.08 в 20:05:18 (UTC+0)
сила сигнала 1 из 5
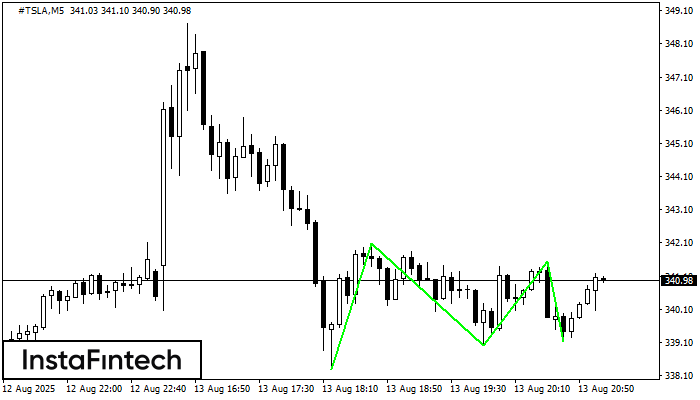
The Triple Bottom pattern has been formed on #TSLA M5. It has the following characteristics: resistance level 342.09/341.55; support level 338.30/339.14; the width is 379 points. In the event
The M5 and M15 time frames may have more false entry points.
Открыть график инструмента в новом окне
Double Bottom
сформирован 13.08 в 20:00:19 (UTC+0)
сила сигнала 1 из 5
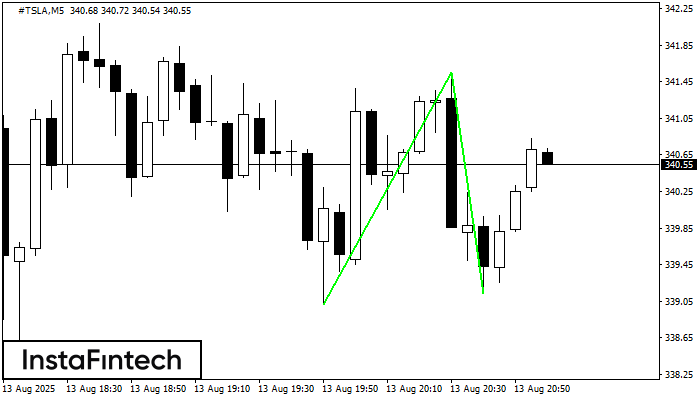
The Double Bottom pattern has been formed on #TSLA M5. Characteristics: the support level 339.01; the resistance level 341.55; the width of the pattern 254 points. If the resistance level
The M5 and M15 time frames may have more false entry points.
Открыть график инструмента в новом окне
Bearish Rectangle
сформирован 13.08 в 18:20:47 (UTC+0)
сила сигнала 1 из 5
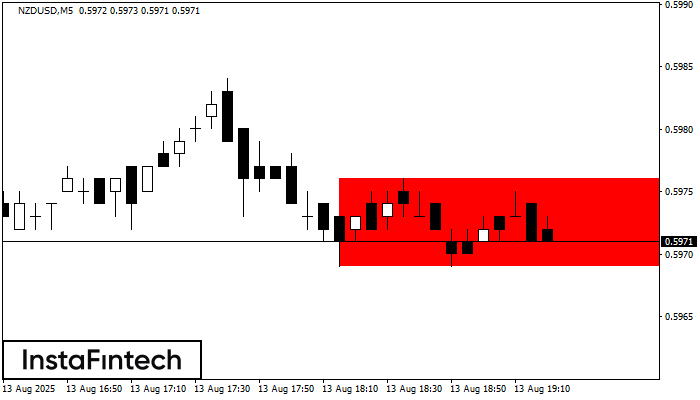
According to the chart of M5, NZDUSD formed the Bearish Rectangle. The pattern indicates a trend continuation. The upper border is 0.5976, the lower border is 0.5969. The signal means
The M5 and M15 time frames may have more false entry points.
Открыть график инструмента в новом окне


