

Өзекті паттерндер

Двойная вершина
сформирован 14.04 в 13:50:14 (UTC+0)
сила сигнала 1 из 5
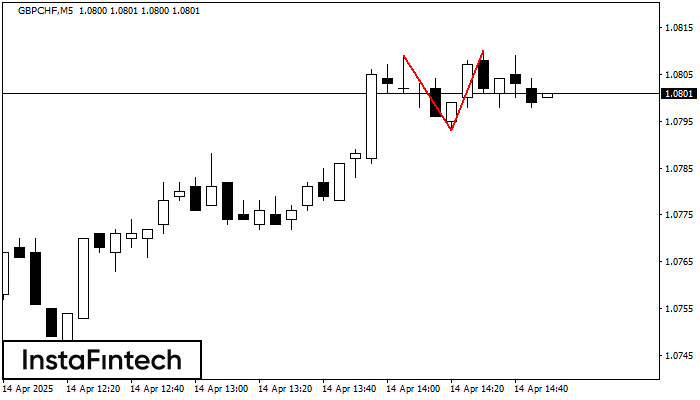
На торговом графике GBPCHF M5 сформировалась разворотная фигура «Двойная вершина». Характеристика: Верхняя граница 1.0810; Нижняя граница 1.0793; Ширина фигуры 17 пунктов. Сигнал: Пробой нижней границы 1.0793 приведет к дальнейшему нисходящему движению с перспективой хода к уровню 1.0778.
Таймфреймы М5 и М15 могут иметь больше ложных точек входа.
- Все
- Все
- Bearish Rectangle
- Bearish Symmetrical Triangle
- Bearish Symmetrical Triangle
- Bullish Rectangle
- Double Top
- Double Top
- Triple Bottom
- Triple Bottom
- Triple Top
- Triple Top
- Все
- Все
- Покупка
- Продажа
- Все
- 1
- 2
- 3
- 4
- 5
รูปแบบกราฟจุดสองยอด (Double Top)
was formed on 03.06 at 09:00:26 (UTC+0)
signal strength 4 of 5
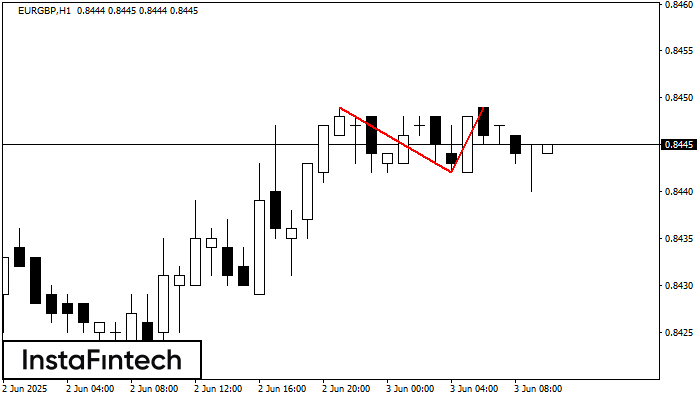
ในชาร์ตของ EURGBP H1 พบว่า กราฟรูปแบบย้อนกลับ รูปแบบกราฟจุดสองยอด (Double Top) ได้ถูกสร้างขึ้นมา คุณลักษณะ: ขอบเขตด้านบน 0.8449; ขอบเขตด้านล่าง 0.8442; ความกว้างของกราฟรูปแบบนี้คือ
Open chart in a new window
รูปแบบกราฟจุดสามยอดขาลง (Triple Bottom)
was formed on 03.06 at 09:00:20 (UTC+0)
signal strength 1 of 5
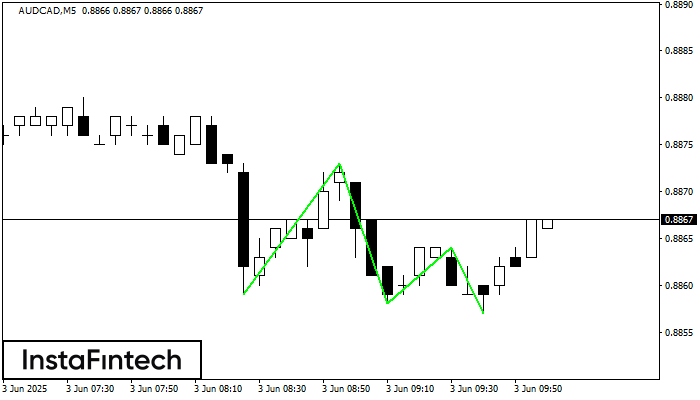
รูปแบบ รูปแบบกราฟจุดสามยอดขาลง (Triple Bottom) ได้สร้างขึ้นมาในชาร์ตของ AUDCAD M5 ลักษณะของกราฟรูปแบบนี้: เส้นด้านล่างของกราฟรูปแบบนี้มีพิกัดอยู่ที่ 0.8873 พร้อมกับลิมิตด้านบน 0.8873/0.8864,ระยะของความกว้างคือ 14 จุด การก่อตัวของกราฟรูปแบบ
ขอบเตระยะเวลาใน M5 และ M15 อาจจะมีตำแหน่งการเข้าใช้งานที่ผิดพลาดมากยิ่งขึ้น
Open chart in a new window
รูปแบบกราฟจุดสองยอดขาลง (Double Bottom)
was formed on 03.06 at 08:45:32 (UTC+0)
signal strength 1 of 5
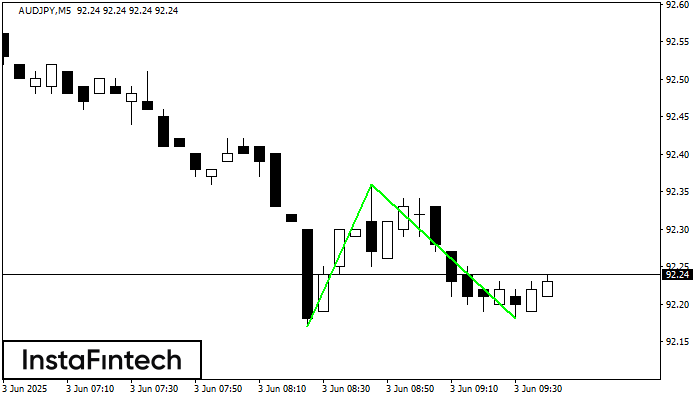
รูปแบบ รูปแบบกราฟจุดสองยอดขาลง (Double Bottom) ถูกสร้างขึ้นมาใน AUDJPY M5 คุณลักษณะ: ระดับของแนวรับ 92.17; ระดับของแนวต้าน 92.36; ความกว้างของรูปแบบ 19 จุด
ขอบเตระยะเวลาใน M5 และ M15 อาจจะมีตำแหน่งการเข้าใช้งานที่ผิดพลาดมากยิ่งขึ้น
Open chart in a new window


