

Өзекті паттерндер

Бычий симметричный треугольник
сформирован 14.04 в 04:00:58 (UTC+0)
сила сигнала 4 из 5

По EURNZD на H1 фигура «Бычий симметричный треугольник». Характеристика: Фигура продолжения тренда; Координаты границ – верхняя 2.0005, нижняя 1.9118. Проекция ширины фигуры 887 пунктов. Прогноз: В случае пробоя верхней границы 2.0005 цена, вероятнее всего, продолжит движение к 1.9525.
- Все
- Все
- Bearish Rectangle
- Bearish Symmetrical Triangle
- Bearish Symmetrical Triangle
- Bullish Rectangle
- Double Top
- Double Top
- Triple Bottom
- Triple Bottom
- Triple Top
- Triple Top
- Все
- Все
- Покупка
- Продажа
- Все
- 1
- 2
- 3
- 4
- 5
Triple Top
was formed on 25.04 at 08:30:10 (UTC+0)
signal strength 1 of 5
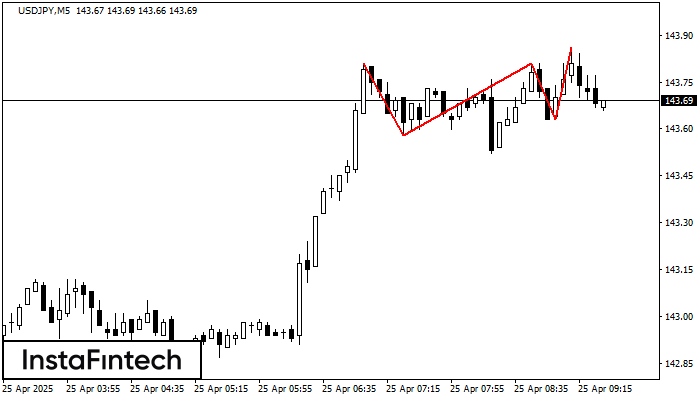
On the chart of the USDJPY M5 trading instrument, the Triple Top pattern that signals a trend change has formed. It is possible that after formation of the third peak
The M5 and M15 time frames may have more false entry points.
Open chart in a new window
Inverse Head and Shoulder
was formed on 25.04 at 08:30:00 (UTC+0)
signal strength 2 of 5
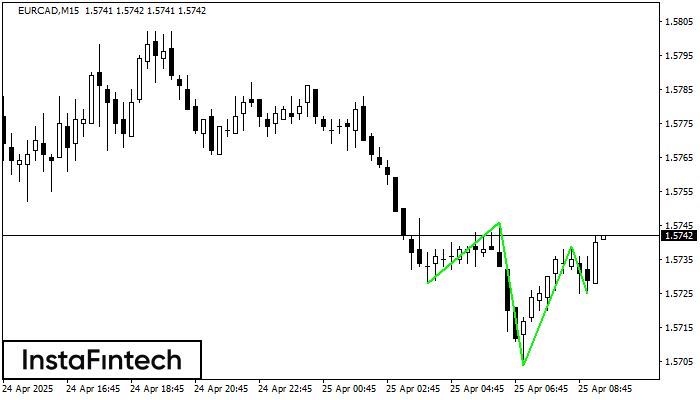
According to M15, EURCAD is shaping the technical pattern – the Inverse Head and Shoulder. In case the Neckline 1.5746/1.5739 is broken out, the instrument is likely to move toward
The M5 and M15 time frames may have more false entry points.
Open chart in a new window
Triple Bottom
was formed on 25.04 at 07:41:10 (UTC+0)
signal strength 1 of 5
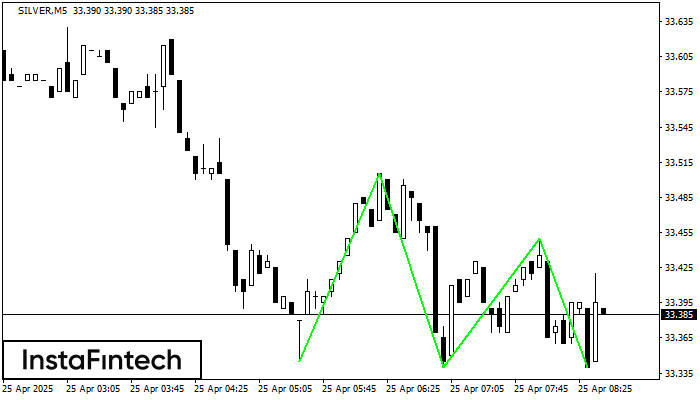
The Triple Bottom pattern has been formed on SILVER M5. It has the following characteristics: resistance level 33.51/33.45; support level 33.34/33.34; the width is 160 points. In the event
The M5 and M15 time frames may have more false entry points.
Open chart in a new window


