

Өзекті паттерндер

Двойная вершина
сформирован 11.04 в 22:10:22 (UTC+0)
сила сигнала 1 из 5

На торговом графике #Bitcoin M5 сформировалась разворотная фигура «Двойная вершина». Характеристика: Верхняя граница 83924.61; Нижняя граница 83599.60; Ширина фигуры 32501 пунктов. Сигнал: Пробой нижней границы 83599.60 приведет к дальнейшему нисходящему движению с перспективой хода к уровню 83599.45.
Таймфреймы М5 и М15 могут иметь больше ложных точек входа.
Сондай-ақ қараңыз
- Все
- Все
- Bearish Rectangle
- Bearish Symmetrical Triangle
- Bearish Symmetrical Triangle
- Bullish Rectangle
- Double Top
- Double Top
- Triple Bottom
- Triple Bottom
- Triple Top
- Triple Top
- Все
- Все
- Покупка
- Продажа
- Все
- 1
- 2
- 3
- 4
- 5
Bullish Rectangle
сформирован 28.08 в 21:21:43 (UTC+0)
сила сигнала 2 из 5
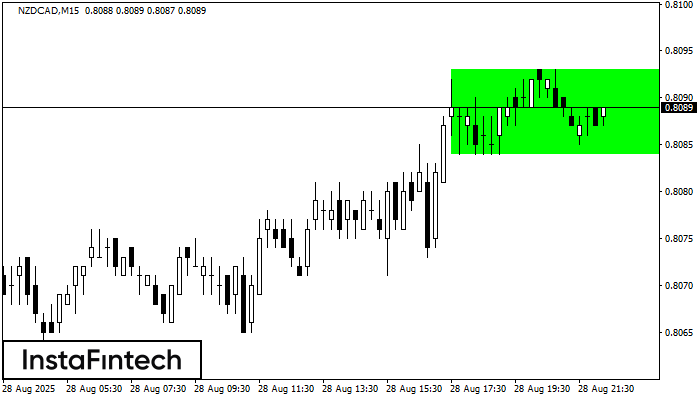
According to the chart of M15, NZDCAD formed the Bullish Rectangle. This type of a pattern indicates a trend continuation. It consists of two levels: resistance 0.8093 and support 0.8084
The M5 and M15 time frames may have more false entry points.
Открыть график инструмента в новом окне
Triple Top
сформирован 28.08 в 21:20:52 (UTC+0)
сила сигнала 1 из 5
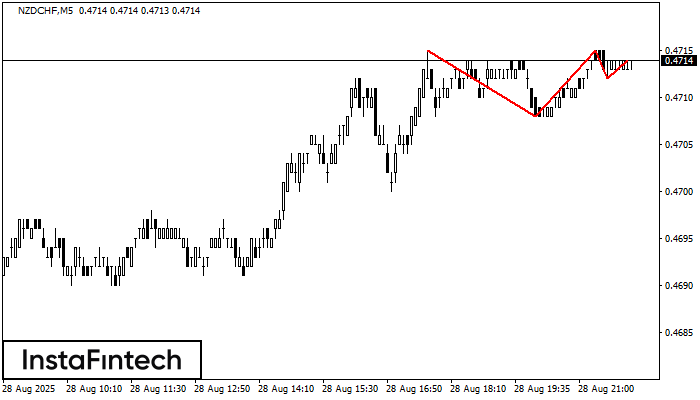
The Triple Top pattern has formed on the chart of the NZDCHF M5 trading instrument. It is a reversal pattern featuring the following characteristics: resistance level 1, support level -4
The M5 and M15 time frames may have more false entry points.
Открыть график инструмента в новом окне
Bullish Symmetrical Triangle
сформирован 28.08 в 21:00:28 (UTC+0)
сила сигнала 2 из 5
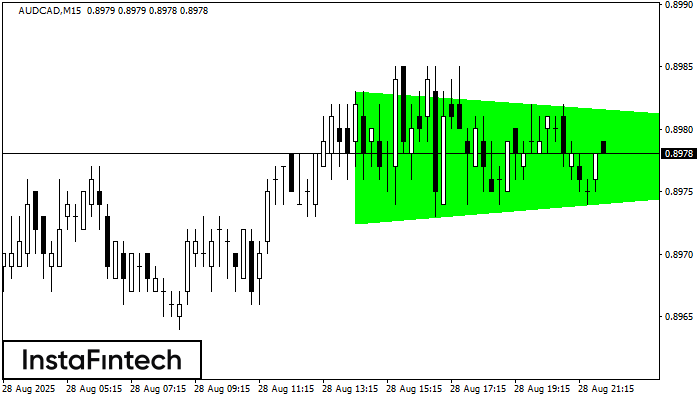
According to the chart of M15, AUDCAD formed the Bullish Symmetrical Triangle pattern. Description: This is the pattern of a trend continuation. 0.8983 and 0.8972 are the coordinates
The M5 and M15 time frames may have more false entry points.
Открыть график инструмента в новом окне


