

Өзекті паттерндер

Двойное дно
сформирован 11.04 в 19:00:41 (UTC+0)
сила сигнала 3 из 5
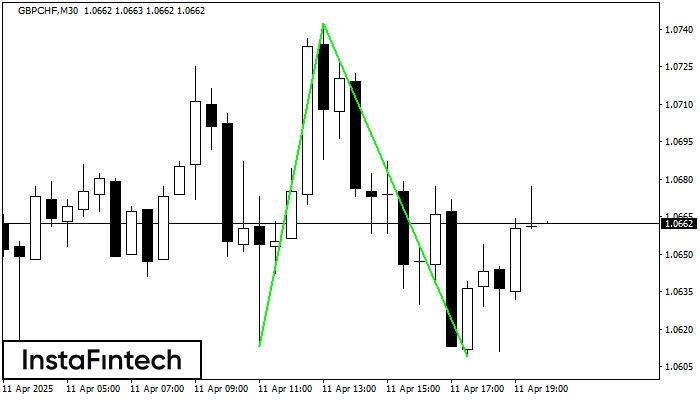
Сформирована фигура «Двойное дно» на графике GBPCHF M30. Данное формирование сигнализирует об изменении тенденции с нисходящего на восходящее движение. Сигнал: Торговую позицию на покупку следует открывать после пробоя верхней границы фигуры 1.0742, где перспектива будущего хода будет являться шириной текущей фигуры - 129 пунктов.
Сондай-ақ қараңыз
- Все
- Все
- Bearish Rectangle
- Bearish Symmetrical Triangle
- Bearish Symmetrical Triangle
- Bullish Rectangle
- Double Top
- Double Top
- Triple Bottom
- Triple Bottom
- Triple Top
- Triple Top
- Все
- Все
- Покупка
- Продажа
- Все
- 1
- 2
- 3
- 4
- 5
Bullish Symmetrical Triangle
was formed on 05.06 at 07:00:39 (UTC+0)
signal strength 1 of 5
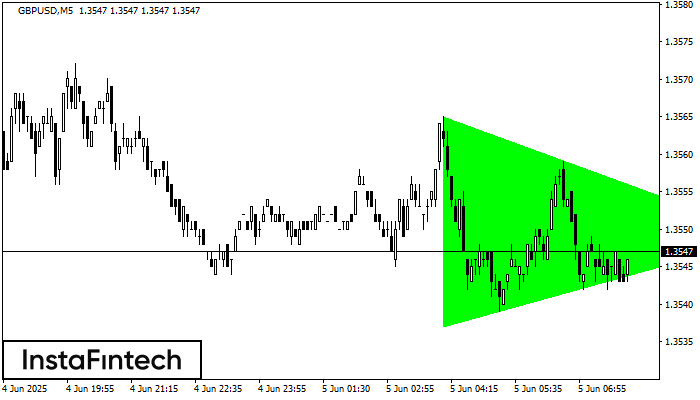
According to the chart of M5, GBPUSD formed the Bullish Symmetrical Triangle pattern. Description: This is the pattern of a trend continuation. 1.3565 and 1.3537 are the coordinates
The M5 and M15 time frames may have more false entry points.
Open chart in a new window
Bearish Symmetrical Triangle
was formed on 05.06 at 06:52:26 (UTC+0)
signal strength 1 of 5
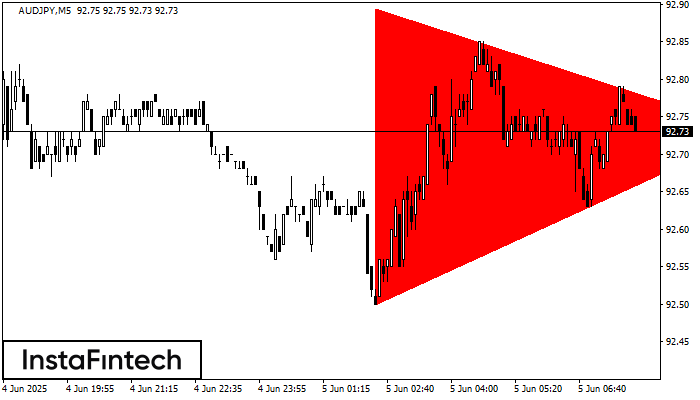
According to the chart of M5, AUDJPY formed the Bearish Symmetrical Triangle pattern. Trading recommendations: A breach of the lower border 92.50 is likely to encourage a continuation
The M5 and M15 time frames may have more false entry points.
Open chart in a new window
Head and Shoulders
was formed on 05.06 at 06:00:32 (UTC+0)
signal strength 2 of 5
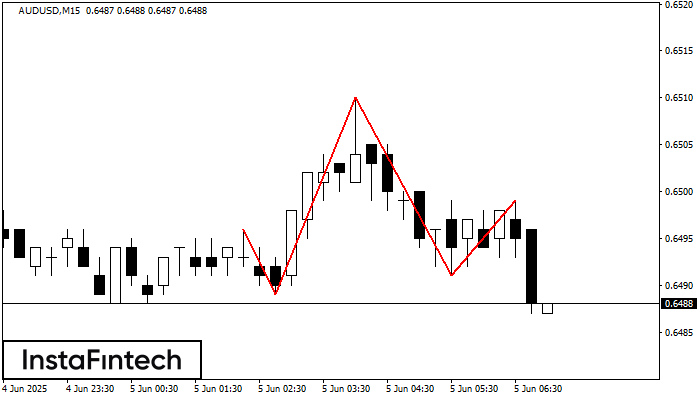
According to the chart of M15, AUDUSD formed the Head and Shoulders pattern. The Head’s top is set at 0.6510 while the median line of the Neck is found
The M5 and M15 time frames may have more false entry points.
Open chart in a new window


