

Өзекті паттерндер

Тройное дно
сформирован 11.04 в 15:45:01 (UTC+0)
сила сигнала 2 из 5
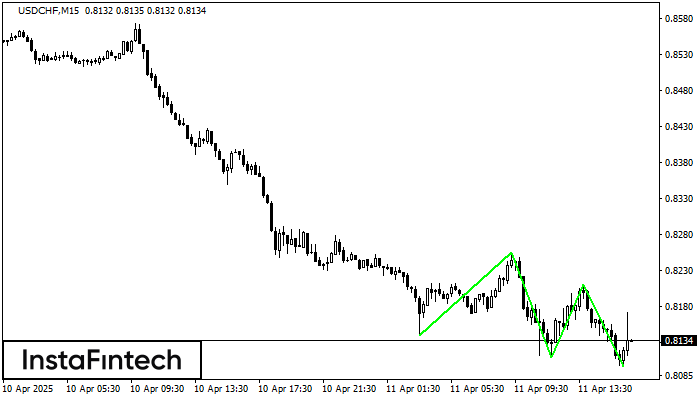
Сформирована фигура «Тройное дно» по торговому инструменту USDCHF на M15. Фигура сигнализирует об изменении тенденции с нисходящей на восходящую в случае пробоя верхней границы 0.8211.
Таймфреймы М5 и М15 могут иметь больше ложных точек входа.
Сондай-ақ қараңыз
- Все
- Все
- Bearish Rectangle
- Bearish Symmetrical Triangle
- Bearish Symmetrical Triangle
- Bullish Rectangle
- Double Top
- Double Top
- Triple Bottom
- Triple Bottom
- Triple Top
- Triple Top
- Все
- Все
- Покупка
- Продажа
- Все
- 1
- 2
- 3
- 4
- 5
Triple Top
сформирован 03.06 в 00:30:20 (UTC+0)
сила сигнала 3 из 5
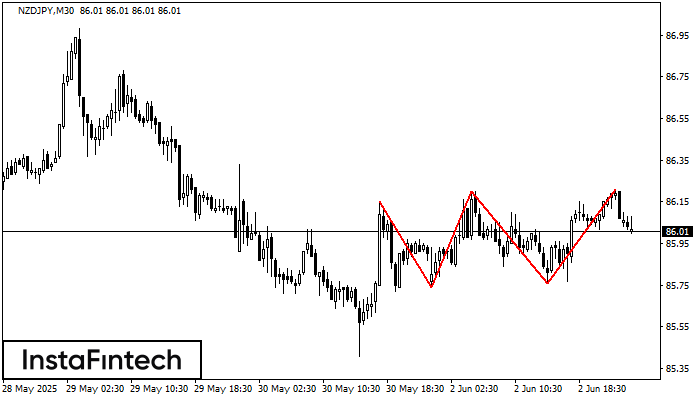
The Triple Top pattern has formed on the chart of the NZDJPY M30. Features of the pattern: borders have an ascending angle; the lower line of the pattern
Открыть график инструмента в новом окне
Triple Bottom
сформирован 03.06 в 00:05:20 (UTC+0)
сила сигнала 1 из 5

The Triple Bottom pattern has formed on the chart of USDJPY M5. Features of the pattern: The lower line of the pattern has coordinates 142.75 with the upper limit 142.75/142.69
The M5 and M15 time frames may have more false entry points.
Открыть график инструмента в новом окне
Triple Bottom
сформирован 03.06 в 00:00:22 (UTC+0)
сила сигнала 3 из 5
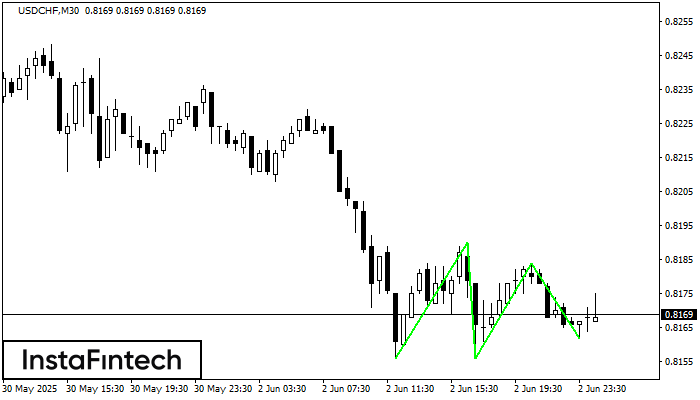
The Triple Bottom pattern has formed on the chart of the USDCHF M30 trading instrument. The pattern signals a change in the trend from downwards to upwards in the case
Открыть график инструмента в новом окне


