

Өзекті паттерндер

Двойная вершина
сформирован 09.04 в 21:50:28 (UTC+0)
сила сигнала 1 из 5
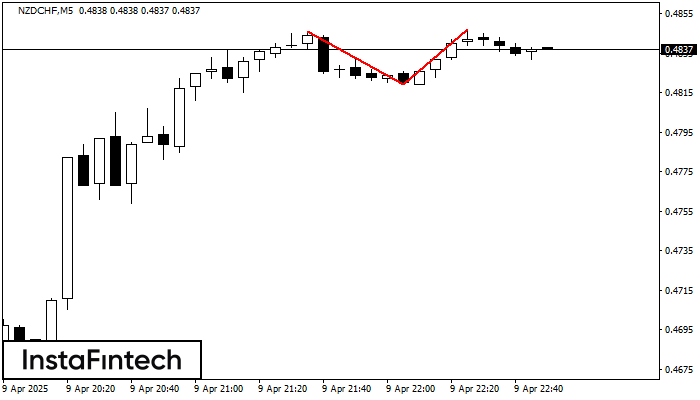
По торговому инструменту NZDCHF на M5 сформировалась фигура «Двойная вершина», которая сигнализирует нам об изменении тенденции с восходящей на нисходящую. Вероятно, что, в случае пробоя основания фигуры 0.4819, возможно дальнейшее нисходящее движение.
Таймфреймы М5 и М15 могут иметь больше ложных точек входа.
- Все
- Все
- Bearish Rectangle
- Bearish Symmetrical Triangle
- Bearish Symmetrical Triangle
- Bullish Rectangle
- Double Top
- Double Top
- Triple Bottom
- Triple Bottom
- Triple Top
- Triple Top
- Все
- Все
- Покупка
- Продажа
- Все
- 1
- 2
- 3
- 4
- 5
Double Bottom
сформирован 02.06 в 08:44:59 (UTC+0)
сила сигнала 2 из 5
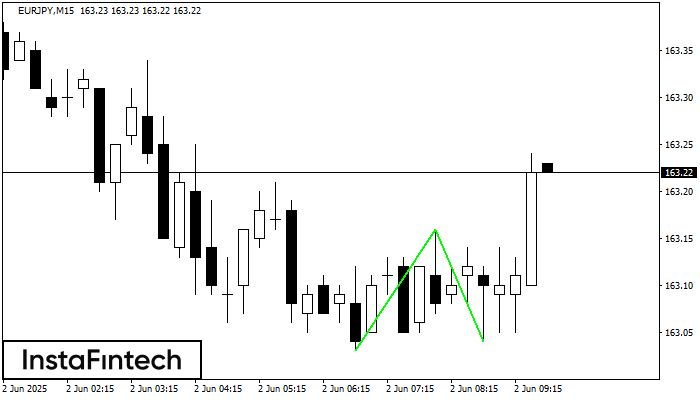
The Double Bottom pattern has been formed on EURJPY M15; the upper boundary is 163.16; the lower boundary is 163.04. The width of the pattern is 13 points. In case
The M5 and M15 time frames may have more false entry points.
Открыть график инструмента в новом окне
Triple Bottom
сформирован 02.06 в 08:44:55 (UTC+0)
сила сигнала 2 из 5
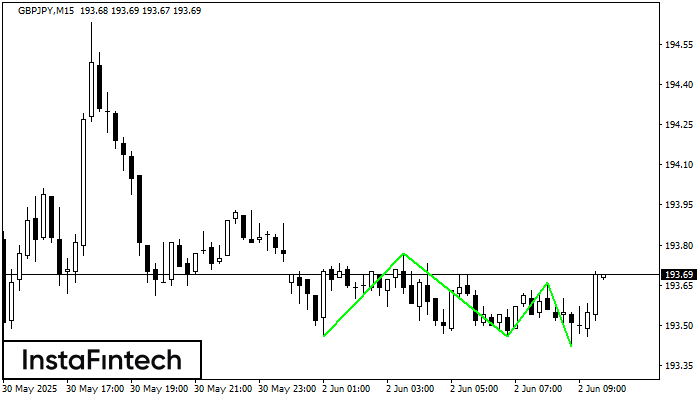
The Triple Bottom pattern has formed on the chart of the GBPJPY M15 trading instrument. The pattern signals a change in the trend from downwards to upwards in the case
The M5 and M15 time frames may have more false entry points.
Открыть график инструмента в новом окне
Bullish Flag
сформирован 02.06 в 07:45:57 (UTC+0)
сила сигнала 1 из 5
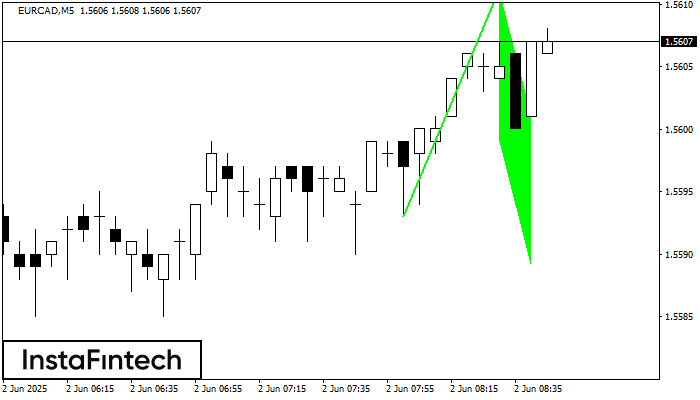
The Bullish Flag pattern which signals continuation of a trend has been formed on the chart EURCAD M5. Forecast: if the price breaks above the pattern high at 1.5611, then
The M5 and M15 time frames may have more false entry points.
Открыть график инструмента в новом окне


