

Өзекті паттерндер

Двойная вершина
сформирован 09.04 в 18:35:43 (UTC+0)
сила сигнала 1 из 5
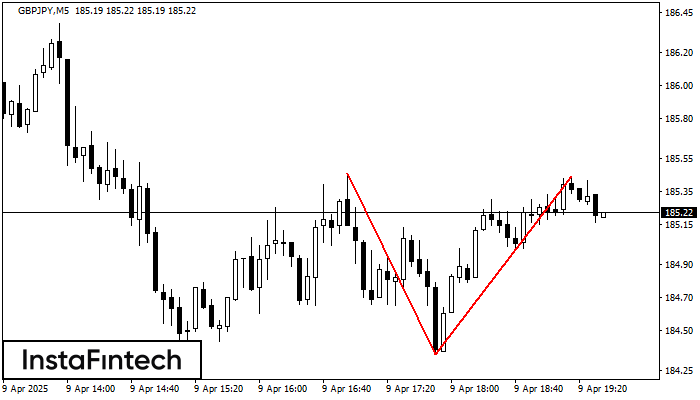
По торговому инструменту GBPJPY на M5 сформировалась фигура «Двойная вершина», которая сигнализирует нам об изменении тенденции с восходящей на нисходящую. Вероятно, что, в случае пробоя основания фигуры 184.35, возможно дальнейшее нисходящее движение.
Таймфреймы М5 и М15 могут иметь больше ложных точек входа.
- Все
- Все
- Bearish Rectangle
- Bearish Symmetrical Triangle
- Bearish Symmetrical Triangle
- Bullish Rectangle
- Double Top
- Double Top
- Triple Bottom
- Triple Bottom
- Triple Top
- Triple Top
- Все
- Все
- Покупка
- Продажа
- Все
- 1
- 2
- 3
- 4
- 5
Triple Bottom
сформирован 03.06 в 00:05:20 (UTC+0)
сила сигнала 1 из 5

The Triple Bottom pattern has formed on the chart of USDJPY M5. Features of the pattern: The lower line of the pattern has coordinates 142.75 with the upper limit 142.75/142.69
The M5 and M15 time frames may have more false entry points.
Открыть график инструмента в новом окне
Triple Bottom
сформирован 03.06 в 00:00:22 (UTC+0)
сила сигнала 3 из 5
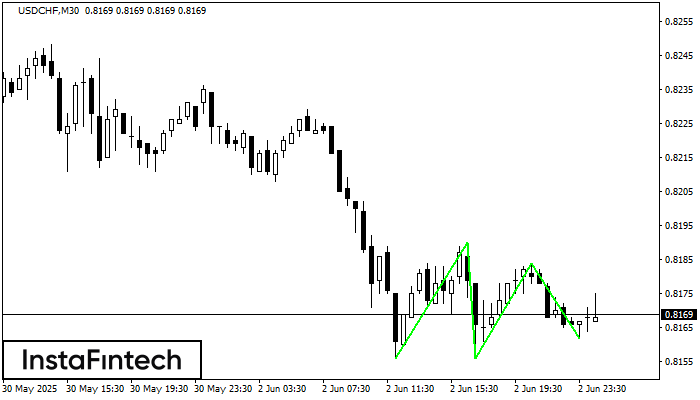
The Triple Bottom pattern has formed on the chart of the USDCHF M30 trading instrument. The pattern signals a change in the trend from downwards to upwards in the case
Открыть график инструмента в новом окне
Head and Shoulders
сформирован 02.06 в 23:51:00 (UTC+0)
сила сигнала 1 из 5
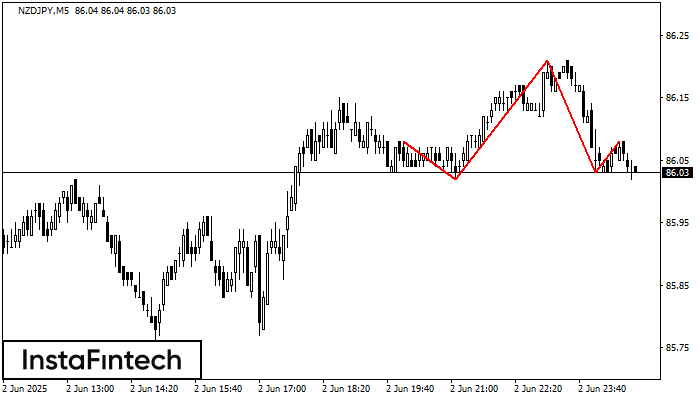
According to the chart of M5, NZDJPY formed the Head and Shoulders pattern. The Head’s top is set at 86.21 while the median line of the Neck is found
The M5 and M15 time frames may have more false entry points.
Открыть график инструмента в новом окне


