

Өзекті паттерндер

Медвежий симметричный треугольник
сформирован 09.04 в 16:48:29 (UTC+0)
сила сигнала 2 из 5
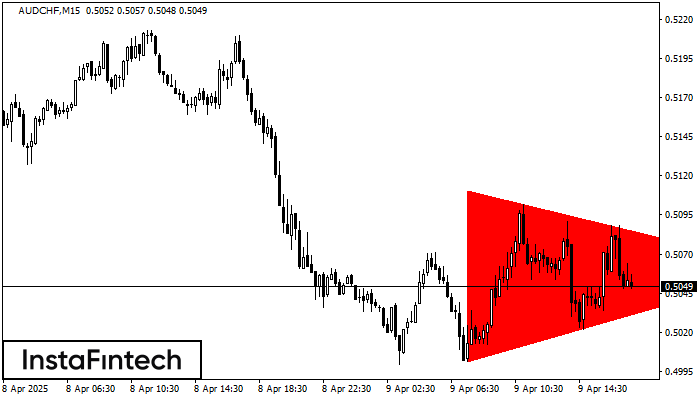
По AUDCHF M15 сформировалась фигура «Медвежий симметричный треугольник». Данная фигура сигнализирует нам о продолжении нисходящего тренда в случае пробоя нижней границы 0.5001, где вероятная прибыль будет являться шириной текущей фигуры -110 пунктов.
Таймфреймы М5 и М15 могут иметь больше ложных точек входа.
- Все
- Все
- Bearish Rectangle
- Bearish Symmetrical Triangle
- Bearish Symmetrical Triangle
- Bullish Rectangle
- Double Top
- Double Top
- Triple Bottom
- Triple Bottom
- Triple Top
- Triple Top
- Все
- Все
- Покупка
- Продажа
- Все
- 1
- 2
- 3
- 4
- 5
Bullish Rectangle
сформирован 29.05 в 20:30:23 (UTC+0)
сила сигнала 4 из 5
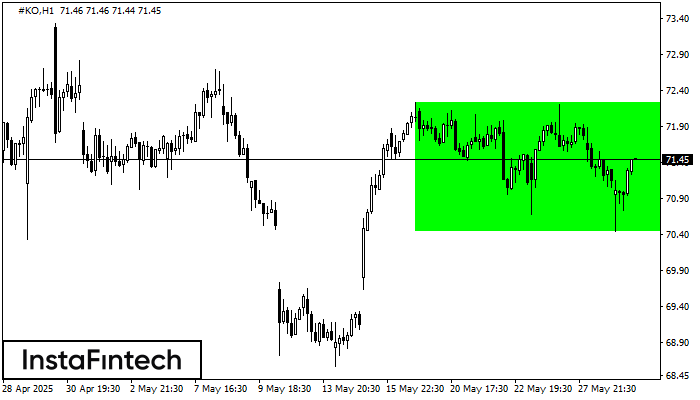
According to the chart of H1, #KO formed the Bullish Rectangle. This type of a pattern indicates a trend continuation. It consists of two levels: resistance 72.24 and support 70.45
Открыть график инструмента в новом окне
Bearish Flag
сформирован 29.05 в 20:13:23 (UTC+0)
сила сигнала 1 из 5
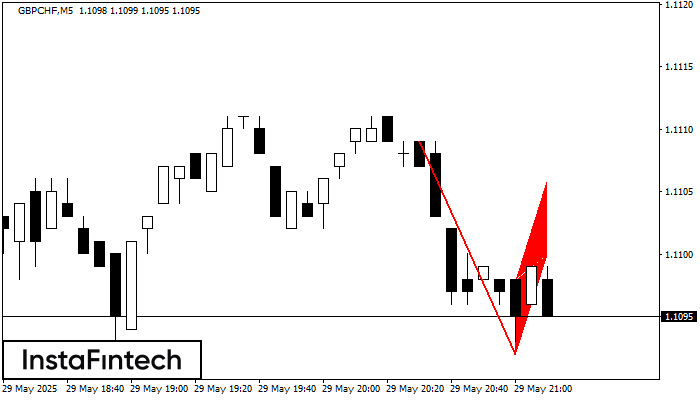
The Bearish Flag pattern has been formed on the chart GBPCHF M5. Therefore, the downwards trend is likely to continue in the nearest term. As soon as the price breaks
The M5 and M15 time frames may have more false entry points.
Открыть график инструмента в новом окне
Double Top
сформирован 29.05 в 20:11:22 (UTC+0)
сила сигнала 1 из 5
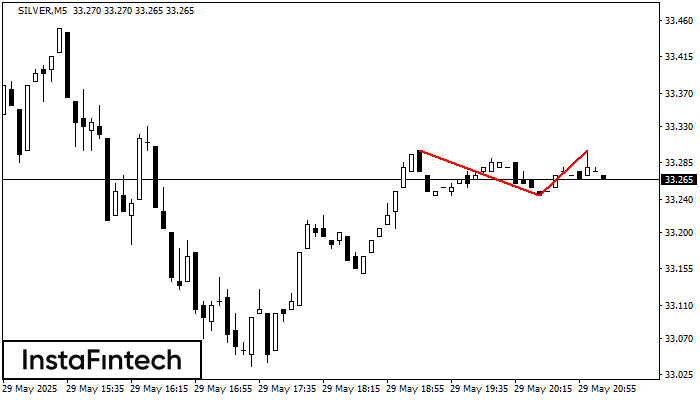
The Double Top reversal pattern has been formed on SILVER M5. Characteristics: the upper boundary 33.30; the lower boundary 33.24; the width of the pattern is 55 points. Sell trades
The M5 and M15 time frames may have more false entry points.
Открыть график инструмента в новом окне


