

Өзекті паттерндер

Двойная вершина
сформирован 08.04 в 18:20:17 (UTC+0)
сила сигнала 1 из 5

По #KO на M5 сформировалась разворотная фигура «Двойная вершина». Характеристика: Верхняя граница 69.94; Нижняя граница 69.49; Ширина фигуры 50 пунктов. Позицию на продажу возможно открыть ниже нижней границы 69.49, с перспективой хода к уровню 69.34.
Таймфреймы М5 и М15 могут иметь больше ложных точек входа.
- Все
- Все
- Bearish Rectangle
- Bearish Symmetrical Triangle
- Bearish Symmetrical Triangle
- Bullish Rectangle
- Double Top
- Double Top
- Triple Bottom
- Triple Bottom
- Triple Top
- Triple Top
- Все
- Все
- Покупка
- Продажа
- Все
- 1
- 2
- 3
- 4
- 5
Double Bottom
сформирован 29.05 в 15:00:17 (UTC+0)
сила сигнала 2 из 5
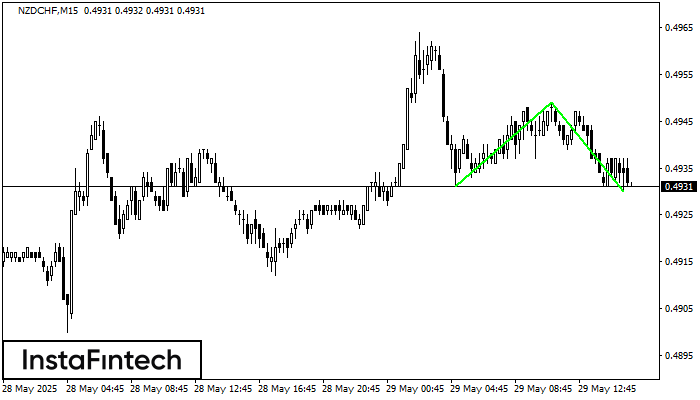
The Double Bottom pattern has been formed on NZDCHF M15; the upper boundary is 0.4949; the lower boundary is 0.4930. The width of the pattern is 18 points. In case
The M5 and M15 time frames may have more false entry points.
Открыть график инструмента в новом окне
Bearish Rectangle
сформирован 29.05 в 14:04:55 (UTC+0)
сила сигнала 2 из 5
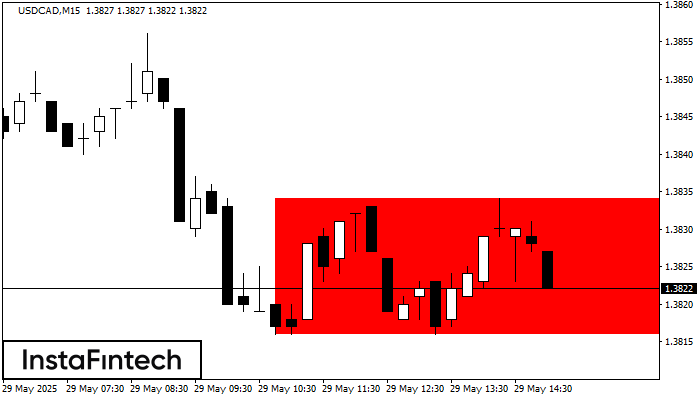
According to the chart of M15, USDCAD formed the Bearish Rectangle. The pattern indicates a trend continuation. The upper border is 1.3834, the lower border is 1.3816. The signal means
The M5 and M15 time frames may have more false entry points.
Открыть график инструмента в новом окне
Bearish Rectangle
сформирован 29.05 в 13:36:16 (UTC+0)
сила сигнала 1 из 5
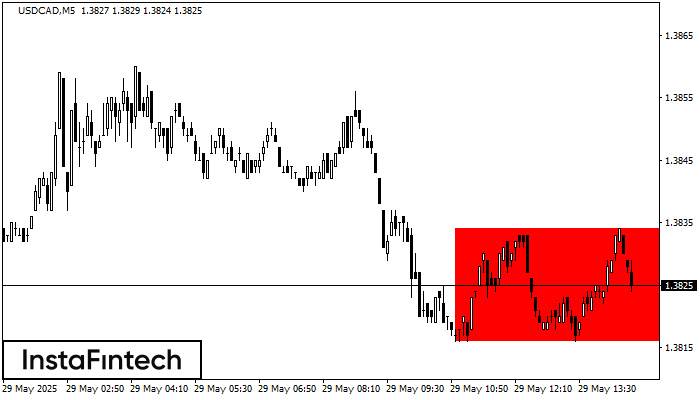
According to the chart of M5, USDCAD formed the Bearish Rectangle which is a pattern of a trend continuation. The pattern is contained within the following borders: lower border 1.3816
The M5 and M15 time frames may have more false entry points.
Открыть график инструмента в новом окне


