

Өзекті паттерндер

Двойное дно
сформирован 08.04 в 18:00:21 (UTC+0)
сила сигнала 4 из 5
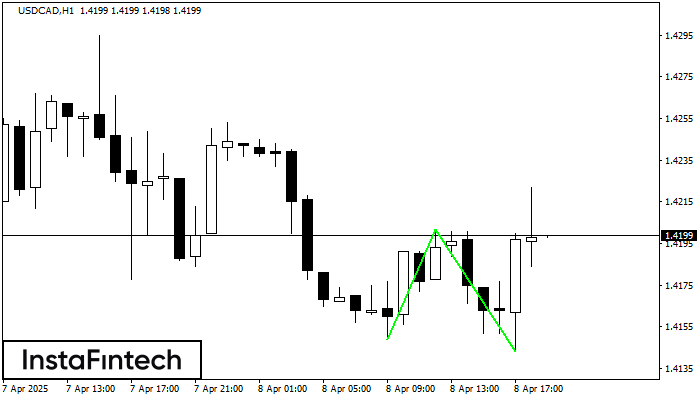
Сформирована фигура «Двойное дно» на графике USDCAD H1. Характеристика: Уровень поддержки 1.4149; Уровень сопротивления 1.4202; Ширина фигуры 53 пунктов. В случае пробоя уровня сопротивления можно будет прогнозировать изменение тенденции, где первая точка фиксации прибыли находится на расстоянии 59 пунктов.
- Все
- Все
- Bearish Rectangle
- Bearish Symmetrical Triangle
- Bearish Symmetrical Triangle
- Bullish Rectangle
- Double Top
- Double Top
- Triple Bottom
- Triple Bottom
- Triple Top
- Triple Top
- Все
- Все
- Покупка
- Продажа
- Все
- 1
- 2
- 3
- 4
- 5
Bullish Symmetrical Triangle
сформирован 28.05 в 21:50:36 (UTC+0)
сила сигнала 1 из 5
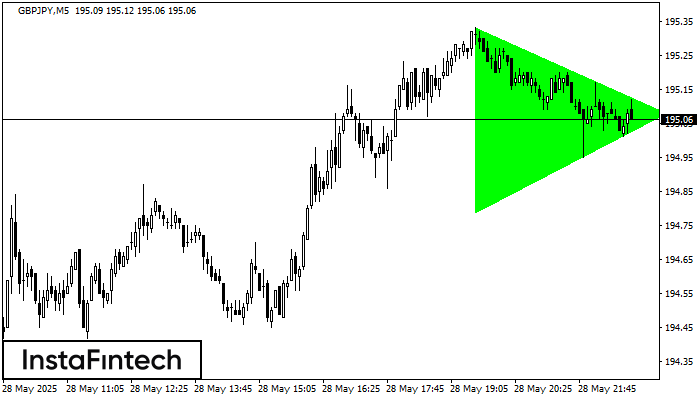
According to the chart of M5, GBPJPY formed the Bullish Symmetrical Triangle pattern. Description: This is the pattern of a trend continuation. 195.33 and 194.79 are the coordinates
The M5 and M15 time frames may have more false entry points.
Открыть график инструмента в новом окне
Bearish Rectangle
сформирован 28.05 в 21:48:16 (UTC+0)
сила сигнала 1 из 5
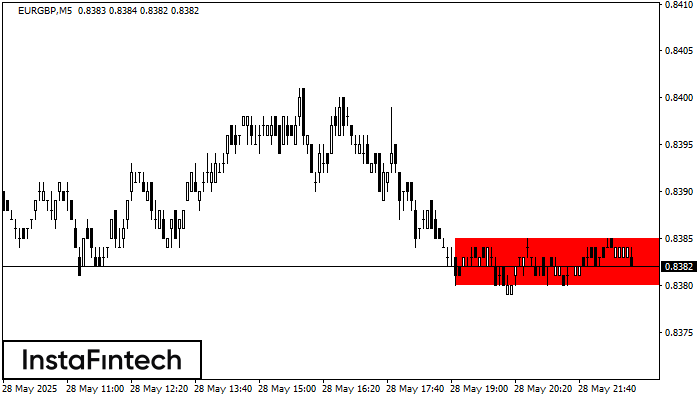
According to the chart of M5, EURGBP formed the Bearish Rectangle which is a pattern of a trend continuation. The pattern is contained within the following borders: lower border 0.8380
The M5 and M15 time frames may have more false entry points.
Открыть график инструмента в новом окне
Inverse Head and Shoulder
сформирован 28.05 в 21:45:23 (UTC+0)
сила сигнала 1 из 5
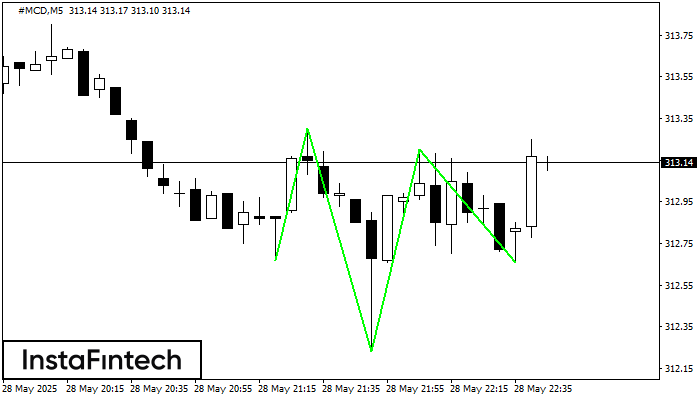
According to M5, #MCD is shaping the technical pattern – the Inverse Head and Shoulder. In case the Neckline 313.30/313.20 is broken out, the instrument is likely to move toward
The M5 and M15 time frames may have more false entry points.
Открыть график инструмента в новом окне


