

Өзекті паттерндер

Двойная вершина
сформирован 08.04 в 11:00:13 (UTC+0)
сила сигнала 1 из 5
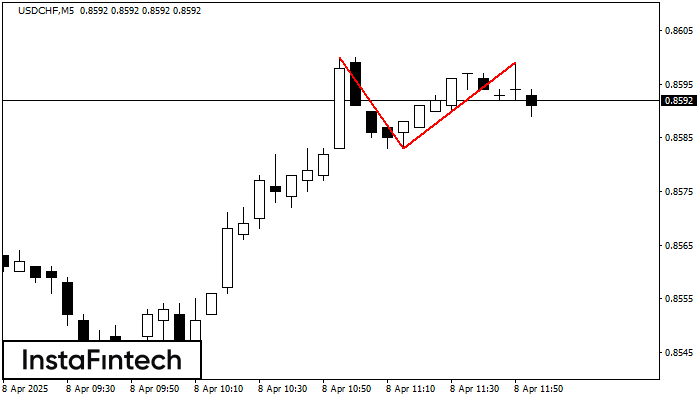
По USDCHF на M5 сформировалась разворотная фигура «Двойная вершина». Характеристика: Верхняя граница 0.8600; Нижняя граница 0.8583; Ширина фигуры 16 пунктов. Позицию на продажу возможно открыть ниже нижней границы 0.8583, с перспективой хода к уровню 0.8568.
Таймфреймы М5 и М15 могут иметь больше ложных точек входа.
Сондай-ақ қараңыз
- Все
- Все
- Bearish Rectangle
- Bearish Symmetrical Triangle
- Bearish Symmetrical Triangle
- Bullish Rectangle
- Double Top
- Double Top
- Triple Bottom
- Triple Bottom
- Triple Top
- Triple Top
- Все
- Все
- Покупка
- Продажа
- Все
- 1
- 2
- 3
- 4
- 5
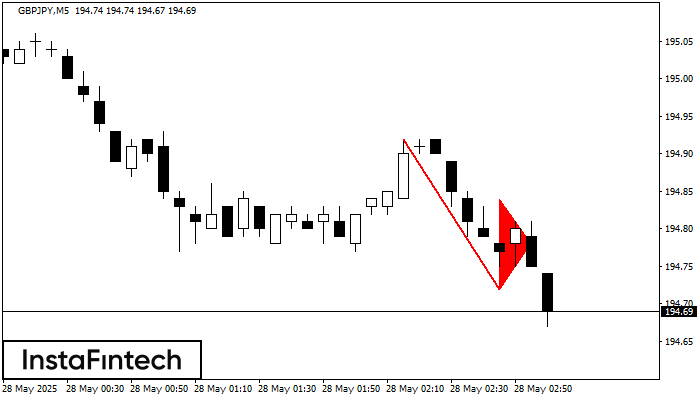
Bearish Flag
was formed on 28.05 at 02:00:49 (UTC+0)
signal strength 1 of 5
The Bearish Flag pattern has been formed on the chart GBPJPY M5. Therefore, the downwards trend is likely to continue in the nearest term. As soon as the price breaks
The M5 and M15 time frames may have more false entry points.
Open chart in a new window
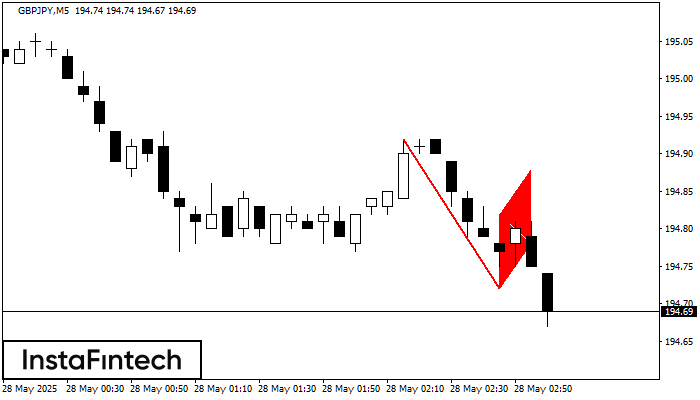
Bearish pennant
was formed on 28.05 at 02:00:43 (UTC+0)
signal strength 1 of 5
The Bearish pennant pattern has formed on the GBPJPY M5 chart. The pattern signals continuation of the downtrend in case the pennant’s low of 194.72 is broken through. Recommendations: Place
The M5 and M15 time frames may have more false entry points.
Open chart in a new window
Double Bottom
was formed on 28.05 at 01:30:30 (UTC+0)
signal strength 2 of 5
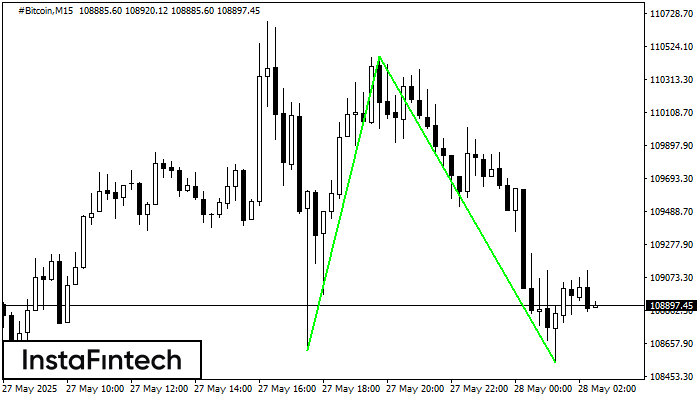
The Double Bottom pattern has been formed on #Bitcoin M15; the upper boundary is 110459.83; the lower boundary is 108539.43. The width of the pattern is 184898 points. In case
The M5 and M15 time frames may have more false entry points.
Open chart in a new window


