

Өзекті паттерндер

Бычий симметричный треугольник
сформирован 07.04 в 04:20:08 (UTC+0)
сила сигнала 2 из 5
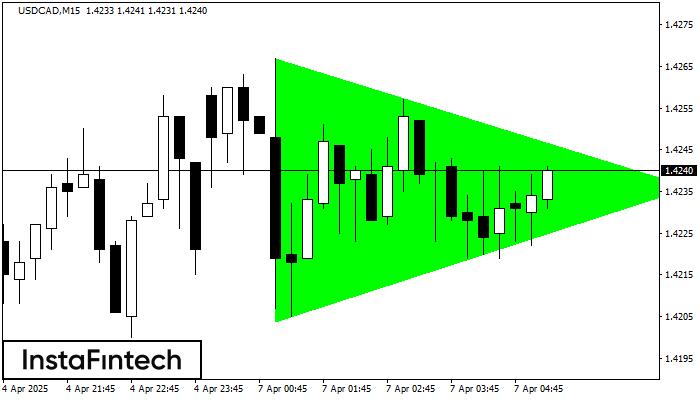
По USDCAD на M15 фигура «Бычий симметричный треугольник». Характеристика: Фигура продолжения тренда; Координаты границ – верхняя 1.4267, нижняя 1.4204. Проекция ширины фигуры 63 пунктов. Прогноз: В случае пробоя верхней границы 1.4267 цена, вероятнее всего, продолжит движение к 1.4259.
Таймфреймы М5 и М15 могут иметь больше ложных точек входа.
Сондай-ақ қараңыз
- Все
- Все
- Bearish Rectangle
- Bearish Symmetrical Triangle
- Bearish Symmetrical Triangle
- Bullish Rectangle
- Double Top
- Double Top
- Triple Bottom
- Triple Bottom
- Triple Top
- Triple Top
- Все
- Все
- Покупка
- Продажа
- Все
- 1
- 2
- 3
- 4
- 5
Double Top
сформирован 06.06 в 22:30:10 (UTC+0)
сила сигнала 2 из 5

On the chart of USDCAD M15 the Double Top reversal pattern has been formed. Characteristics: the upper boundary 1.3702; the lower boundary 1.3668; the width of the pattern 34 points
The M5 and M15 time frames may have more false entry points.
Открыть график инструмента в новом окне
Bullish Symmetrical Triangle
сформирован 06.06 в 22:18:11 (UTC+0)
сила сигнала 2 из 5

According to the chart of M15, AUDJPY formed the Bullish Symmetrical Triangle pattern. The lower border of the pattern touches the coordinates 93.96/94.02 whereas the upper border goes across 94.07/94.02
The M5 and M15 time frames may have more false entry points.
Открыть график инструмента в новом окне
Triple Bottom
сформирован 06.06 в 22:01:08 (UTC+0)
сила сигнала 3 из 5

The Triple Bottom pattern has formed on the chart of the GBPAUD M30 trading instrument. The pattern signals a change in the trend from downwards to upwards in the case
Открыть график инструмента в новом окне


