

Өзекті паттерндер

Двойная вершина
сформирован 07.04 в 02:30:10 (UTC+0)
сила сигнала 1 из 5
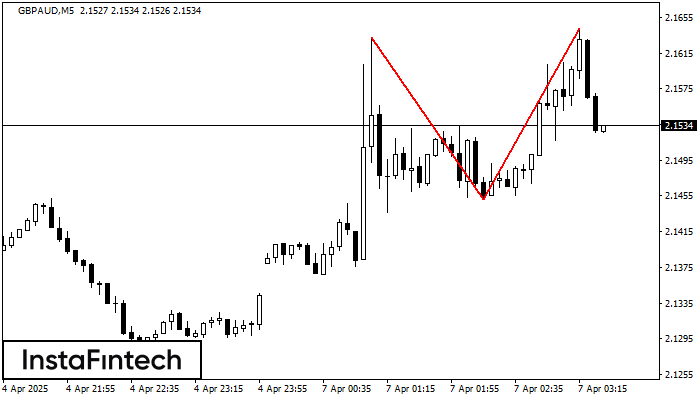
На торговом графике GBPAUD M5 сформировалась разворотная фигура «Двойная вершина». Характеристика: Верхняя граница 2.1642; Нижняя граница 2.1451; Ширина фигуры 191 пунктов. Сигнал: Пробой нижней границы 2.1451 приведет к дальнейшему нисходящему движению с перспективой хода к уровню 2.1436.
Таймфреймы М5 и М15 могут иметь больше ложных точек входа.
- Все
- Все
- Bearish Rectangle
- Bearish Symmetrical Triangle
- Bearish Symmetrical Triangle
- Bullish Rectangle
- Double Top
- Double Top
- Triple Bottom
- Triple Bottom
- Triple Top
- Triple Top
- Все
- Все
- Покупка
- Продажа
- Все
- 1
- 2
- 3
- 4
- 5
Bearish Symmetrical Triangle
was formed on 02.06 at 21:58:20 (UTC+0)
signal strength 1 of 5
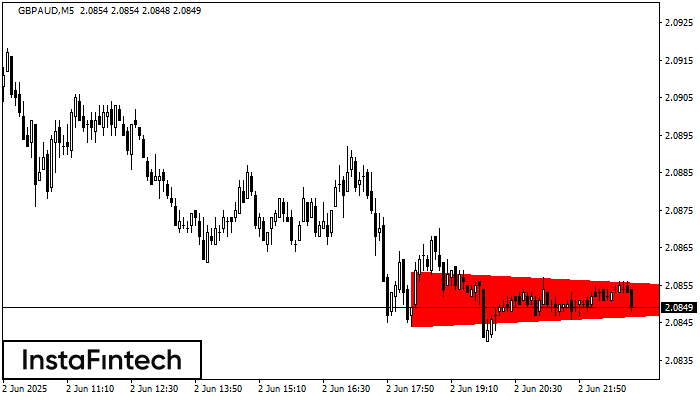
According to the chart of M5, GBPAUD formed the Bearish Symmetrical Triangle pattern. Description: The lower border is 2.0844/2.0851 and upper border is 2.0859/2.0851. The pattern width is measured
The M5 and M15 time frames may have more false entry points.
Open chart in a new window
Double Top
was formed on 02.06 at 21:45:24 (UTC+0)
signal strength 1 of 5
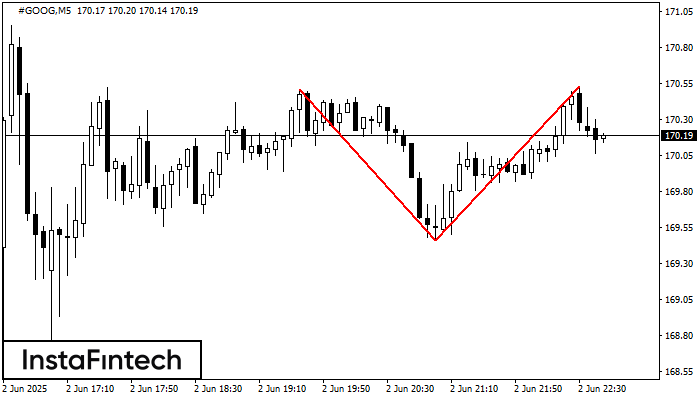
On the chart of #GOOG M5 the Double Top reversal pattern has been formed. Characteristics: the upper boundary 170.53; the lower boundary 169.46; the width of the pattern 107 points
The M5 and M15 time frames may have more false entry points.
Open chart in a new window
Bullish Rectangle
was formed on 02.06 at 21:36:21 (UTC+0)
signal strength 3 of 5
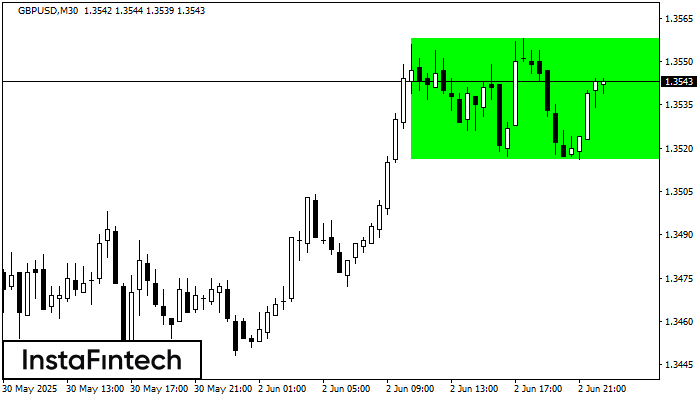
According to the chart of M30, GBPUSD formed the Bullish Rectangle. This type of a pattern indicates a trend continuation. It consists of two levels: resistance 1.3558 and support 1.3516
Open chart in a new window


