

Өзекті паттерндер

Медвежий симметричный треугольник
сформирован 07.04 в 01:33:12 (UTC+0)
сила сигнала 1 из 5
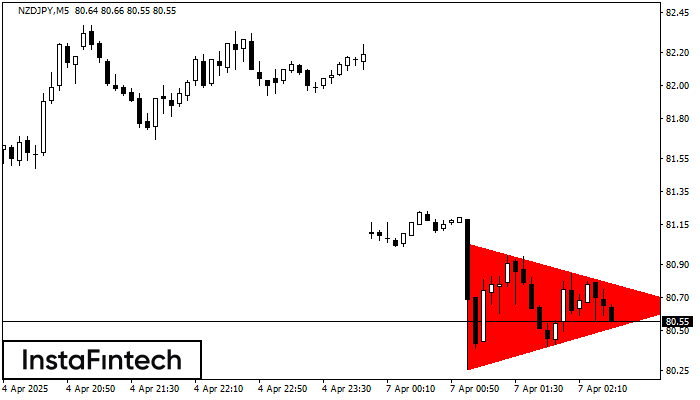
На графике NZDJPY на M5 сформировалась фигура «Медвежий симметричный треугольник». Торговые рекомендации: Пробой нижней границы 80.26 с большой долей вероятности приведет к продолжению нисходящего тренда.
Таймфреймы М5 и М15 могут иметь больше ложных точек входа.
Сондай-ақ қараңыз
- Все
- Все
- Bearish Rectangle
- Bearish Symmetrical Triangle
- Bearish Symmetrical Triangle
- Bullish Rectangle
- Double Top
- Double Top
- Triple Bottom
- Triple Bottom
- Triple Top
- Triple Top
- Все
- Все
- Покупка
- Продажа
- Все
- 1
- 2
- 3
- 4
- 5
Bearish pennant
сформирован 05.06 в 16:45:18 (UTC+0)
сила сигнала 2 из 5

The Bearish pennant pattern has formed on the #TSLA M15 chart. This pattern type is characterized by a slight slowdown after which the price will move in the direction
The M5 and M15 time frames may have more false entry points.
Открыть график инструмента в новом окне
Bearish pennant
сформирован 05.06 в 16:45:10 (UTC+0)
сила сигнала 2 из 5
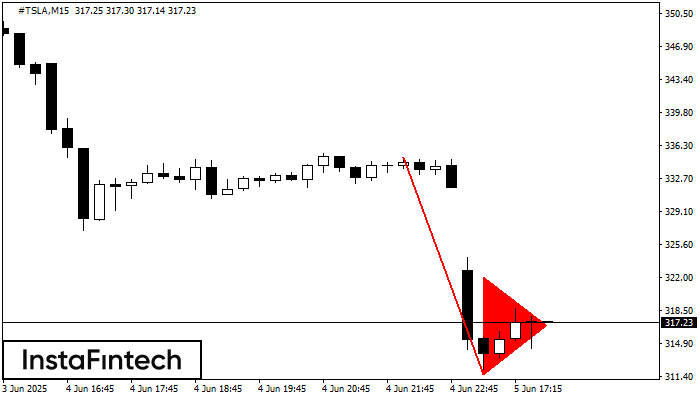
The Bearish pennant pattern has formed on the #TSLA M15 chart. It signals potential continuation of the existing trend. Specifications: the pattern’s bottom has the coordinate of 311.59; the projection
The M5 and M15 time frames may have more false entry points.
Открыть график инструмента в новом окне
Double Top
сформирован 05.06 в 16:40:32 (UTC+0)
сила сигнала 1 из 5
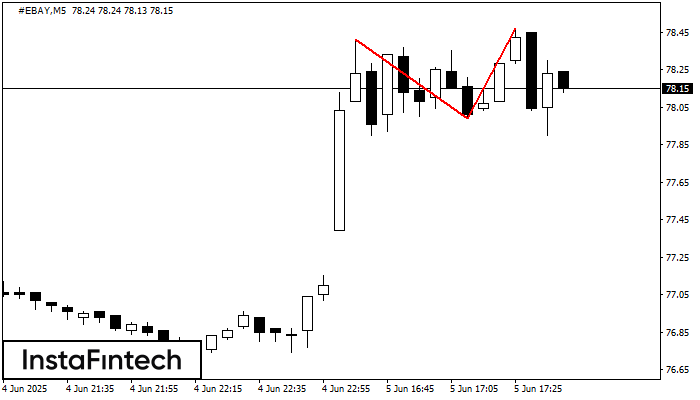
The Double Top pattern has been formed on #EBAY M5. It signals that the trend has been changed from upwards to downwards. Probably, if the base of the pattern 77.99
The M5 and M15 time frames may have more false entry points.
Открыть график инструмента в новом окне


