

Өзекті паттерндер

Двойное дно
сформирован 04.04 в 20:00:33 (UTC+0)
сила сигнала 3 из 5
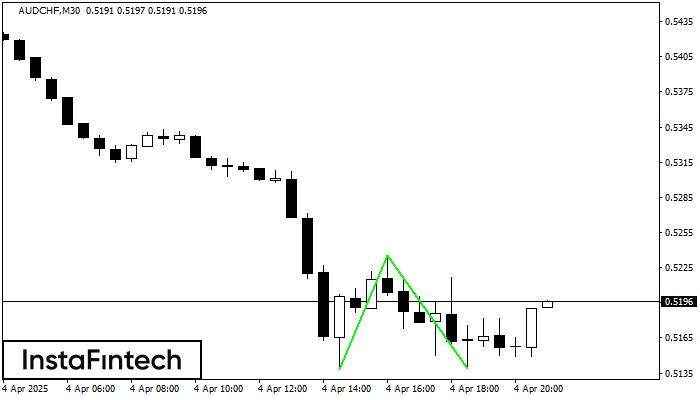
Сформирована фигура «Двойное дно» на графике AUDCHF M30. Верхняя граница 0.5235; Нижняя граница 0.5139; Ширина фигуры 97 пунктов. В случае пробоя верхней границы 0.5235 можно будет прогнозировать изменение тенденции, где ширина фигуры и будет являться расстоянием предположительного Тейк Профита.
Сондай-ақ қараңыз
- Все
- Все
- Bearish Rectangle
- Bearish Symmetrical Triangle
- Bearish Symmetrical Triangle
- Bullish Rectangle
- Double Top
- Double Top
- Triple Bottom
- Triple Bottom
- Triple Top
- Triple Top
- Все
- Все
- Покупка
- Продажа
- Все
- 1
- 2
- 3
- 4
- 5
Bullish Rectangle
сформирован 05.09 в 05:26:01 (UTC+0)
сила сигнала 1 из 5
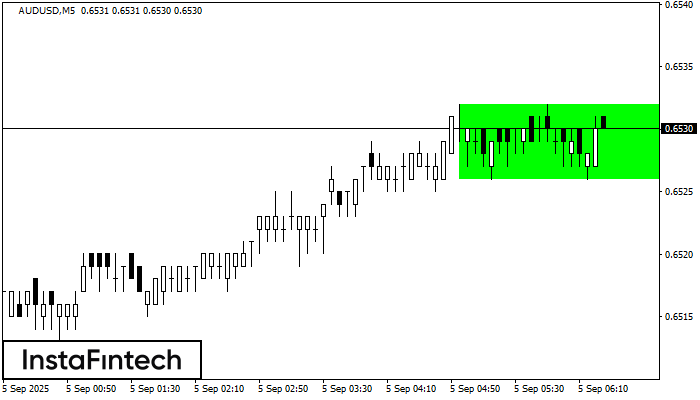
According to the chart of M5, AUDUSD formed the Bullish Rectangle. The pattern indicates a trend continuation. The upper border is 0.6532, the lower border is 0.6526. The signal means
The M5 and M15 time frames may have more false entry points.
Открыть график инструмента в новом окне
Double Top
сформирован 05.09 в 05:05:31 (UTC+0)
сила сигнала 1 из 5
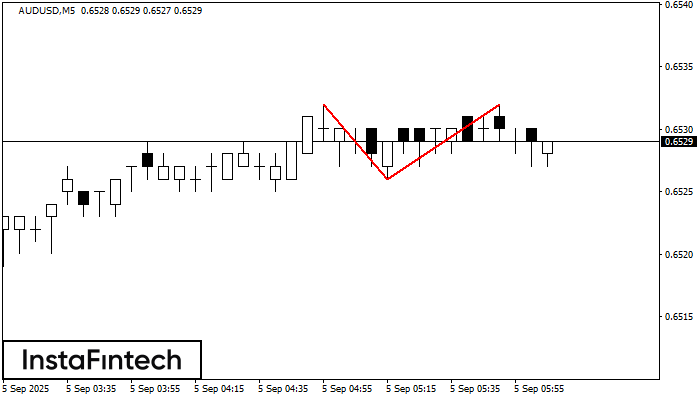
The Double Top reversal pattern has been formed on AUDUSD M5. Characteristics: the upper boundary 0.6532; the lower boundary 0.6526; the width of the pattern is 6 points. Sell trades
The M5 and M15 time frames may have more false entry points.
Открыть график инструмента в новом окне
Double Bottom
сформирован 05.09 в 04:35:43 (UTC+0)
сила сигнала 1 из 5
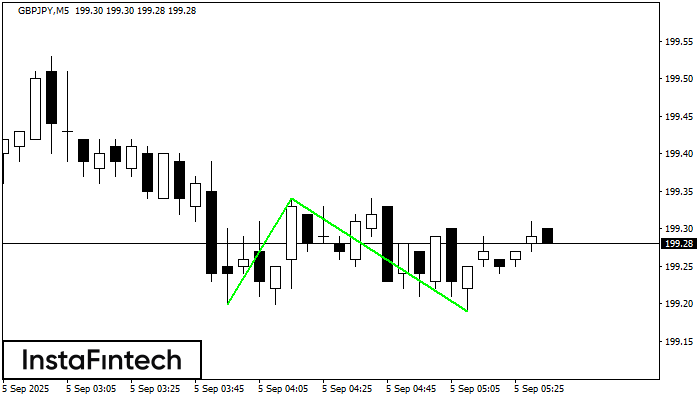
The Double Bottom pattern has been formed on GBPJPY M5; the upper boundary is 199.34; the lower boundary is 199.19. The width of the pattern is 14 points. In case
The M5 and M15 time frames may have more false entry points.
Открыть график инструмента в новом окне


