

Өзекті паттерндер

Медвежий флаг
сформирован 04.04 в 17:33:28 (UTC+0)
сила сигнала 2 из 5

На графике #TSLA M15 сформировалась фигура «Медвежий флаг», которая сигнализирует о продолжении нисходящего тренда. В случае, если цена зафиксируется ниже минимума фигуры 235.81, движение вниз, скорее всего, продолжится. Перспективой будущего движения будет являться проекция высоты флагштока (15 пунктов).
Таймфреймы М5 и М15 могут иметь больше ложных точек входа.
Сондай-ақ қараңыз
- Все
- Все
- Bearish Rectangle
- Bearish Symmetrical Triangle
- Bearish Symmetrical Triangle
- Bullish Rectangle
- Double Top
- Double Top
- Triple Bottom
- Triple Bottom
- Triple Top
- Triple Top
- Все
- Все
- Покупка
- Продажа
- Все
- 1
- 2
- 3
- 4
- 5
Bullish Symmetrical Triangle
сформирован 26.11 в 09:25:23 (UTC+0)
сила сигнала 1 из 5
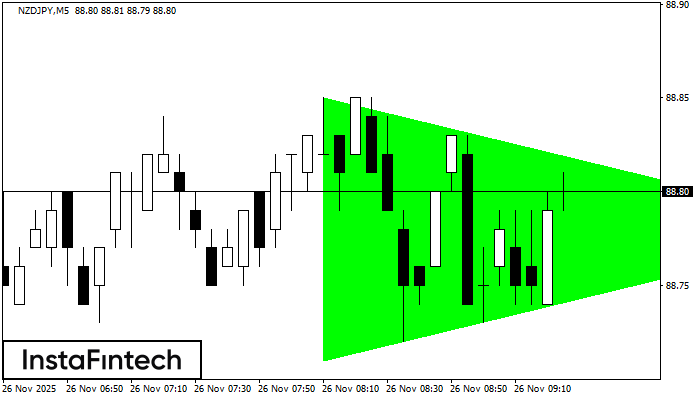
According to the chart of M5, NZDJPY formed the Bullish Symmetrical Triangle pattern. Description: This is the pattern of a trend continuation. 88.85 and 88.71 are the coordinates
The M5 and M15 time frames may have more false entry points.
Открыть график инструмента в новом окне
Double Bottom
сформирован 26.11 в 09:00:19 (UTC+0)
сила сигнала 1 из 5
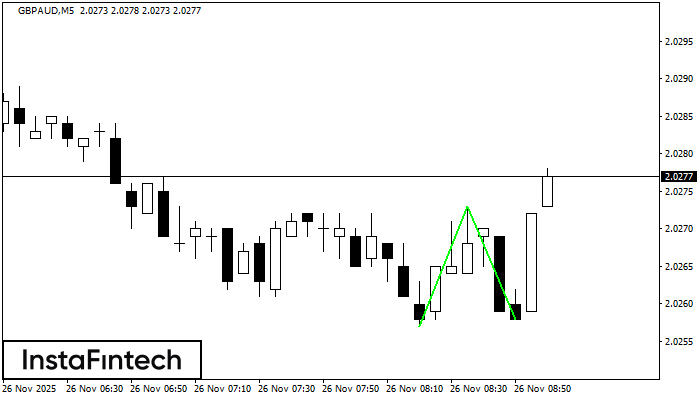
The Double Bottom pattern has been formed on GBPAUD M5; the upper boundary is 2.0273; the lower boundary is 2.0258. The width of the pattern is 16 points. In case
The M5 and M15 time frames may have more false entry points.
Открыть график инструмента в новом окне
Double Top
сформирован 26.11 в 08:45:23 (UTC+0)
сила сигнала 2 из 5
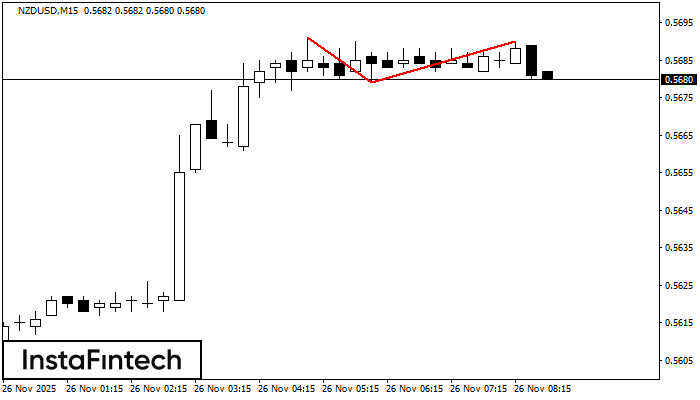
The Double Top reversal pattern has been formed on NZDUSD M15. Characteristics: the upper boundary 0.5691; the lower boundary 0.5679; the width of the pattern is 11 points. Sell trades
The M5 and M15 time frames may have more false entry points.
Открыть график инструмента в новом окне


