

Өзекті паттерндер

Медвежий вымпел
сформирован 03.04 в 20:01:45 (UTC+0)
сила сигнала 4 из 5
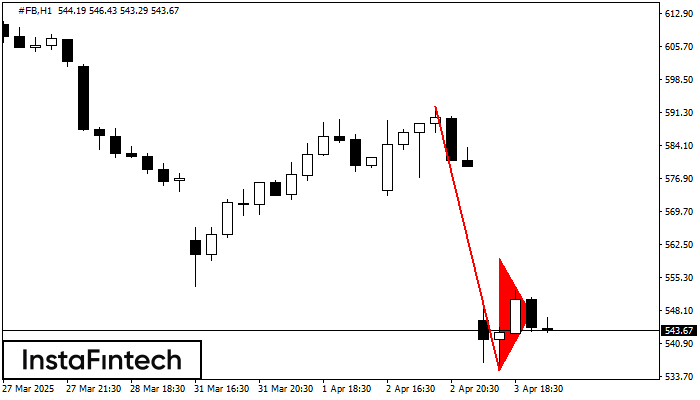
На графике #FB H1 сформировалась фигура «Медвежий вымпел». Фигура сигнализирует о продолжении нисходящего тренда в случае пробоя минимума вымпела 535.05. Рекомендации: Отложенный ордер Sell Stop выставляется на 10 пунктов ниже минимума фигуры. Тейк Профит выставляется на расстояние проекции высоты флагштока.
- Все
- Все
- Bearish Rectangle
- Bearish Symmetrical Triangle
- Bearish Symmetrical Triangle
- Bullish Rectangle
- Double Top
- Double Top
- Triple Bottom
- Triple Bottom
- Triple Top
- Triple Top
- Все
- Все
- Покупка
- Продажа
- Все
- 1
- 2
- 3
- 4
- 5
Double Top
сформирован 02.06 в 03:20:17 (UTC+0)
сила сигнала 1 из 5
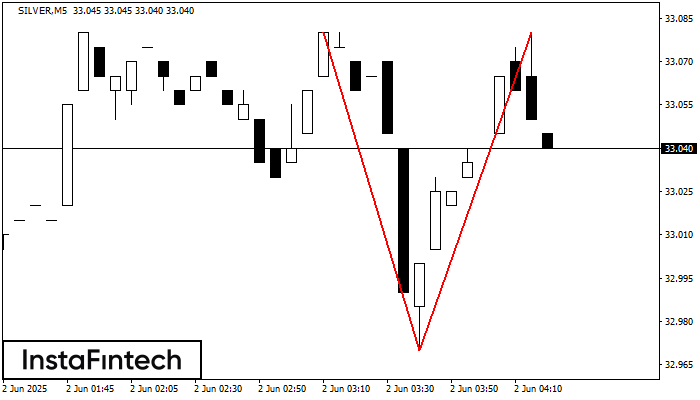
The Double Top pattern has been formed on SILVER M5. It signals that the trend has been changed from upwards to downwards. Probably, if the base of the pattern 32.97
The M5 and M15 time frames may have more false entry points.
Открыть график инструмента в новом окне
Bullish pennant
сформирован 02.06 в 02:15:09 (UTC+0)
сила сигнала 2 из 5
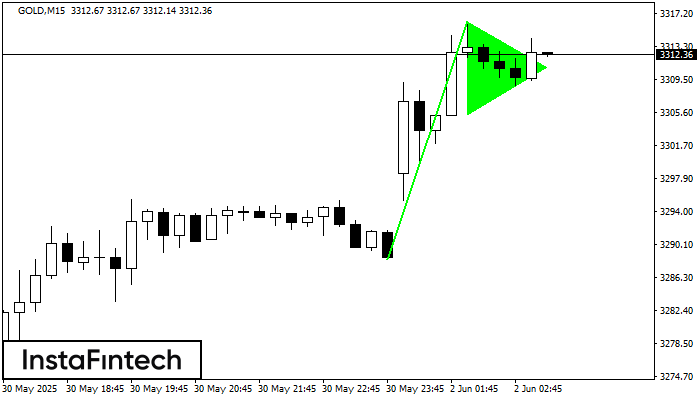
The Bullish pennant pattern is formed on the GOLD M15 chart. It is a type of the continuation pattern. Supposedly, in case the price is fixed above the pennant’s high
The M5 and M15 time frames may have more false entry points.
Открыть график инструмента в новом окне
Double Top
сформирован 02.06 в 02:00:45 (UTC+0)
сила сигнала 2 из 5
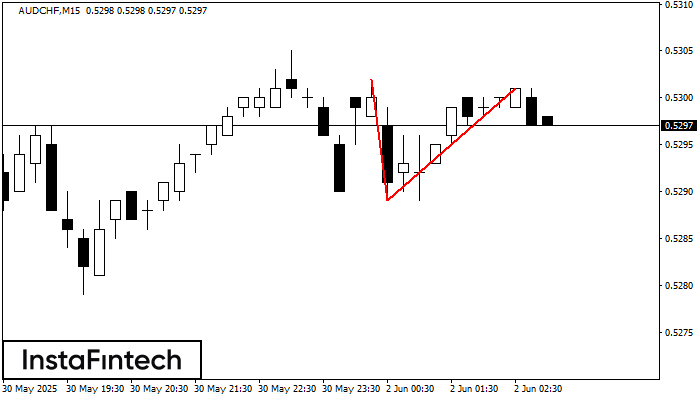
On the chart of AUDCHF M15 the Double Top reversal pattern has been formed. Characteristics: the upper boundary 0.5301; the lower boundary 0.5289; the width of the pattern 12 points
The M5 and M15 time frames may have more false entry points.
Открыть график инструмента в новом окне


