

Өзекті паттерндер

Прямоугольник
сформирован 03.04 в 17:50:21 (UTC+0)
сила сигнала 1 из 5
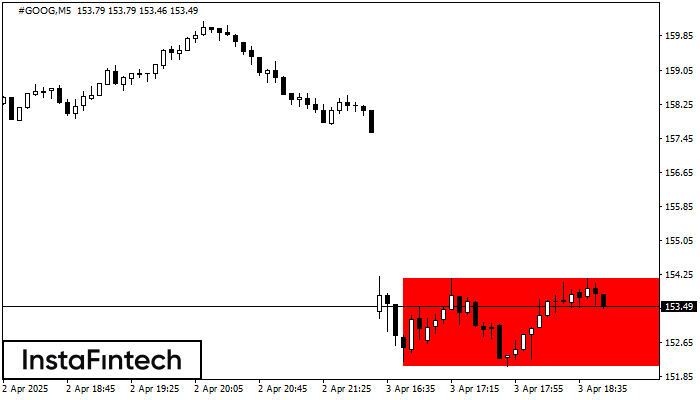
Сформирована фигура «Прямоугольник» на графике #GOOG M5. Тип фигуры: Продолжение тренда; Границы: Верхняя 154.17, Нижняя 152.10; Сигнал: позиция на продажу открывается после фиксации цены ниже границы прямоугольника 152.10.
Таймфреймы М5 и М15 могут иметь больше ложных точек входа.
Сондай-ақ қараңыз
- Все
- Все
- Bearish Rectangle
- Bearish Symmetrical Triangle
- Bearish Symmetrical Triangle
- Bullish Rectangle
- Double Top
- Double Top
- Triple Bottom
- Triple Bottom
- Triple Top
- Triple Top
- Все
- Все
- Покупка
- Продажа
- Все
- 1
- 2
- 3
- 4
- 5
Bullish pennant
сформирован 02.06 в 20:15:54 (UTC+0)
сила сигнала 1 из 5
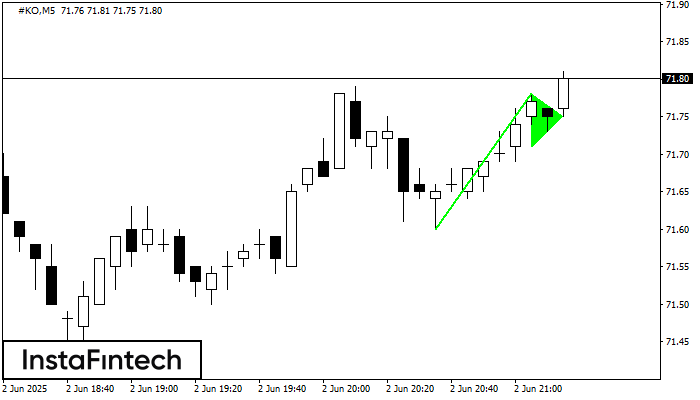
The Bullish pennant signal – Trading instrument #KO M5, continuation pattern. Forecast: it is possible to set up a buy position above the pattern’s high of 71.78, with the prospect
The M5 and M15 time frames may have more false entry points.
Открыть график инструмента в новом окне
Bullish Rectangle
сформирован 02.06 в 19:48:14 (UTC+0)
сила сигнала 2 из 5
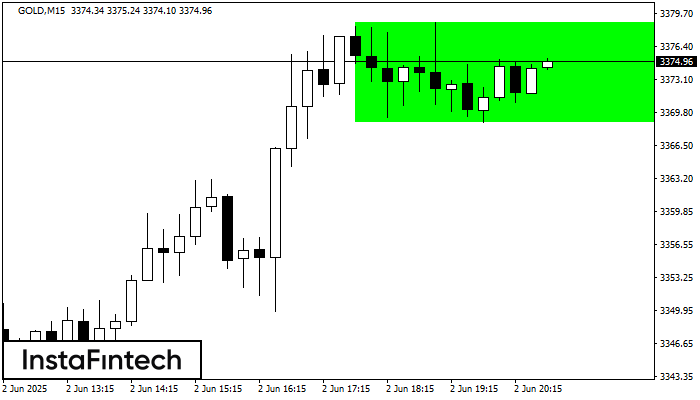
According to the chart of M15, GOLD formed the Bullish Rectangle which is a pattern of a trend continuation. The pattern is contained within the following borders: the lower border
The M5 and M15 time frames may have more false entry points.
Открыть график инструмента в новом окне
Bullish pennant
сформирован 02.06 в 19:30:53 (UTC+0)
сила сигнала 3 из 5
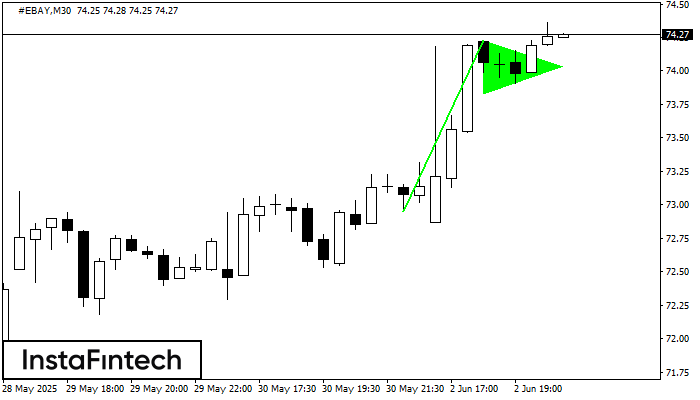
The Bullish pennant signal – Trading instrument #EBAY M30, continuation pattern. Forecast: it is possible to set up a buy position above the pattern’s high of 74.23, with the prospect
Открыть график инструмента в новом окне


