

Өзекті паттерндер

Медвежий вымпел
сформирован 03.04 в 13:11:53 (UTC+0)
сила сигнала 1 из 5
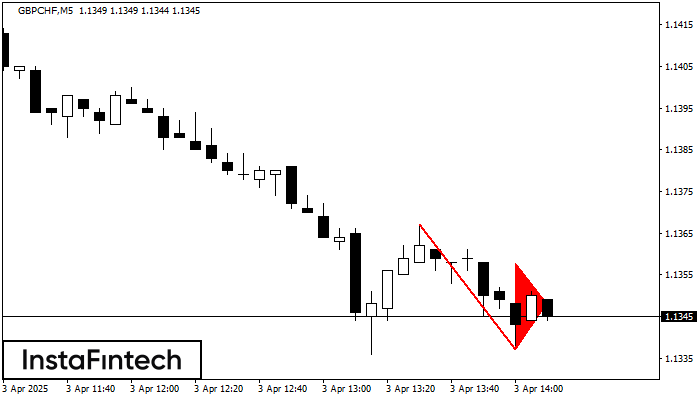
На графике GBPCHF M5 сформировалась фигура «Медвежий вымпел». Фигура сигнализирует о продолжении нисходящего тренда в случае пробоя минимума вымпела 1.1337. Рекомендации: Отложенный ордер Sell Stop выставляется на 10 пунктов ниже минимума фигуры. Тейк Профит выставляется на расстояние проекции высоты флагштока.
Таймфреймы М5 и М15 могут иметь больше ложных точек входа.
Сондай-ақ қараңыз
- Все
- Все
- Bearish Rectangle
- Bearish Symmetrical Triangle
- Bearish Symmetrical Triangle
- Bullish Rectangle
- Double Top
- Double Top
- Triple Bottom
- Triple Bottom
- Triple Top
- Triple Top
- Все
- Все
- Покупка
- Продажа
- Все
- 1
- 2
- 3
- 4
- 5
Double Top
was formed on 06.06 at 02:15:19 (UTC+0)
signal strength 1 of 5
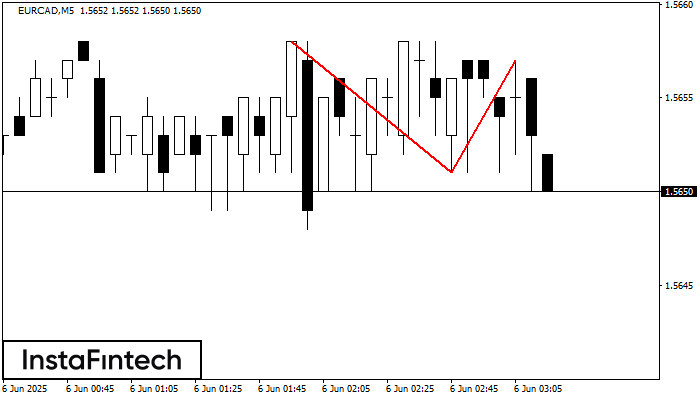
The Double Top reversal pattern has been formed on EURCAD M5. Characteristics: the upper boundary 1.5658; the lower boundary 1.5651; the width of the pattern is 6 points. Sell trades
The M5 and M15 time frames may have more false entry points.
Open chart in a new window
Double Bottom
was formed on 06.06 at 00:25:20 (UTC+0)
signal strength 1 of 5
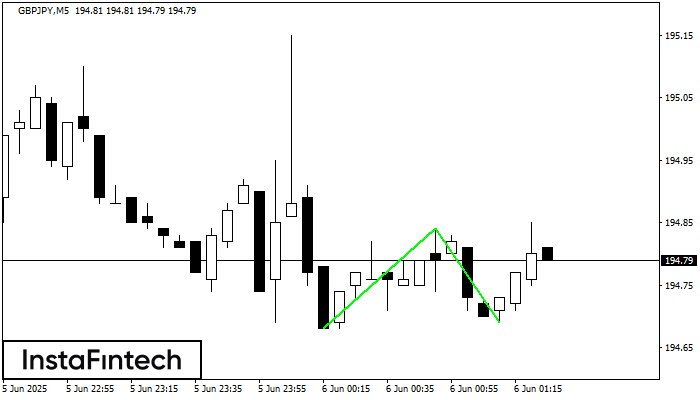
The Double Bottom pattern has been formed on GBPJPY M5. Characteristics: the support level 194.68; the resistance level 194.84; the width of the pattern 16 points. If the resistance level
The M5 and M15 time frames may have more false entry points.
Open chart in a new window
Double Bottom
was formed on 06.06 at 00:20:24 (UTC+0)
signal strength 1 of 5
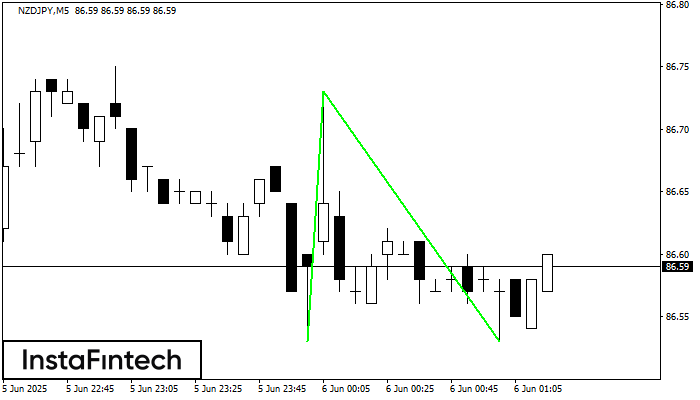
The Double Bottom pattern has been formed on NZDJPY M5; the upper boundary is 86.73; the lower boundary is 86.53. The width of the pattern is 20 points. In case
The M5 and M15 time frames may have more false entry points.
Open chart in a new window


