

Өзекті паттерндер

Тройное дно
сформирован 03.04 в 08:00:19 (UTC+0)
сила сигнала 2 из 5
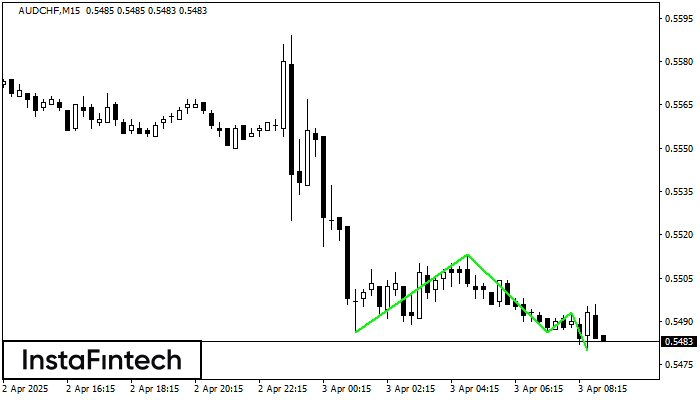
По торговому инструменту AUDCHF на M15 была сформирована графическая фигура «Тройное дно» с характеристиками: Уровень сопротивления 0.5493; Уровень поддержки 0.5480; Ширина 13 пунктов. В случае пробоя уровня сопротивления 0.5513 котировка, скорее всего, продолжит восходящее движение как минимум на 27 пунктов.
Таймфреймы М5 и М15 могут иметь больше ложных точек входа.
- Все
- Все
- Bearish Rectangle
- Bearish Symmetrical Triangle
- Bearish Symmetrical Triangle
- Bullish Rectangle
- Double Top
- Double Top
- Triple Bottom
- Triple Bottom
- Triple Top
- Triple Top
- Все
- Все
- Покупка
- Продажа
- Все
- 1
- 2
- 3
- 4
- 5
Double Top
was formed on 06.06 at 22:30:10 (UTC+0)
signal strength 2 of 5

On the chart of USDCAD M15 the Double Top reversal pattern has been formed. Characteristics: the upper boundary 1.3702; the lower boundary 1.3668; the width of the pattern 34 points
The M5 and M15 time frames may have more false entry points.
Open chart in a new window
Bullish Symmetrical Triangle
was formed on 06.06 at 22:18:11 (UTC+0)
signal strength 2 of 5

According to the chart of M15, AUDJPY formed the Bullish Symmetrical Triangle pattern. The lower border of the pattern touches the coordinates 93.96/94.02 whereas the upper border goes across 94.07/94.02
The M5 and M15 time frames may have more false entry points.
Open chart in a new window
Triple Bottom
was formed on 06.06 at 22:01:08 (UTC+0)
signal strength 3 of 5

The Triple Bottom pattern has formed on the chart of the GBPAUD M30 trading instrument. The pattern signals a change in the trend from downwards to upwards in the case
Open chart in a new window


