

Өзекті паттерндер

Двойная вершина
сформирован 03.04 в 06:30:16 (UTC+0)
сила сигнала 3 из 5
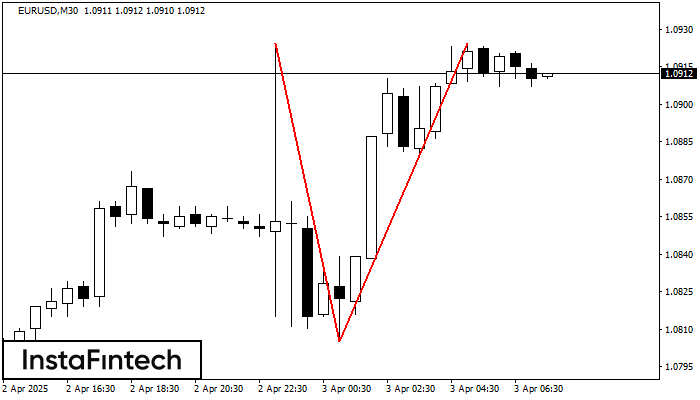
По торговому инструменту EURUSD на M30 сформировалась фигура «Двойная вершина», которая сигнализирует нам об изменении тенденции с восходящей на нисходящую. Вероятно, что, в случае пробоя основания фигуры 1.0805, возможно дальнейшее нисходящее движение.
Сондай-ақ қараңыз
- Все
- Все
- Bearish Rectangle
- Bearish Symmetrical Triangle
- Bearish Symmetrical Triangle
- Bullish Rectangle
- Double Top
- Double Top
- Triple Bottom
- Triple Bottom
- Triple Top
- Triple Top
- Все
- Все
- Покупка
- Продажа
- Все
- 1
- 2
- 3
- 4
- 5
Double Bottom
сформирован 26.11 в 10:30:23 (UTC+0)
сила сигнала 3 из 5
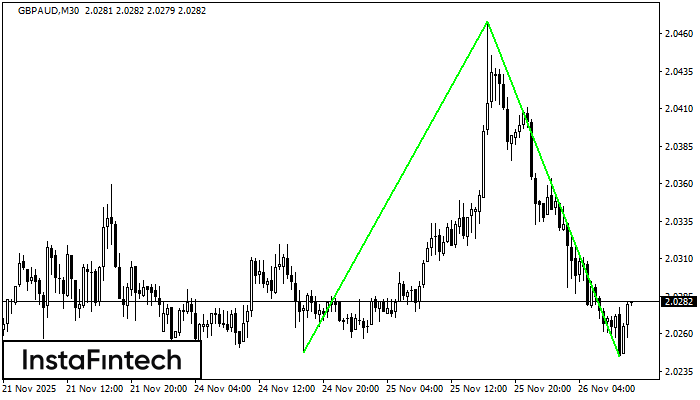
The Double Bottom pattern has been formed on GBPAUD M30. Characteristics: the support level 2.0248; the resistance level 2.0468; the width of the pattern 220 points. If the resistance level
Открыть график инструмента в новом окне
Double Bottom
сформирован 26.11 в 10:15:25 (UTC+0)
сила сигнала 2 из 5
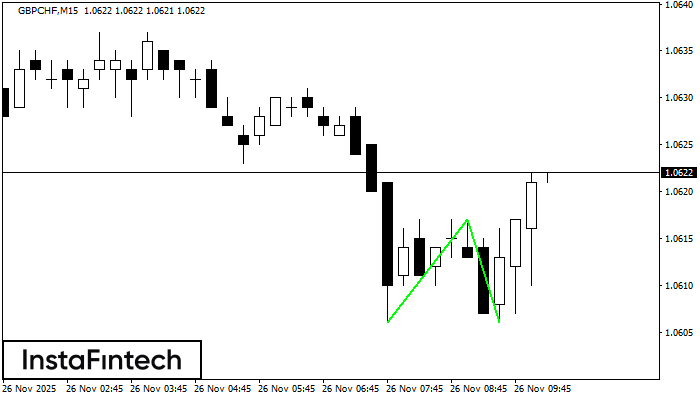
The Double Bottom pattern has been formed on GBPCHF M15; the upper boundary is 1.0617; the lower boundary is 1.0606. The width of the pattern is 11 points. In case
The M5 and M15 time frames may have more false entry points.
Открыть график инструмента в новом окне
Bullish Symmetrical Triangle
сформирован 26.11 в 09:25:23 (UTC+0)
сила сигнала 1 из 5
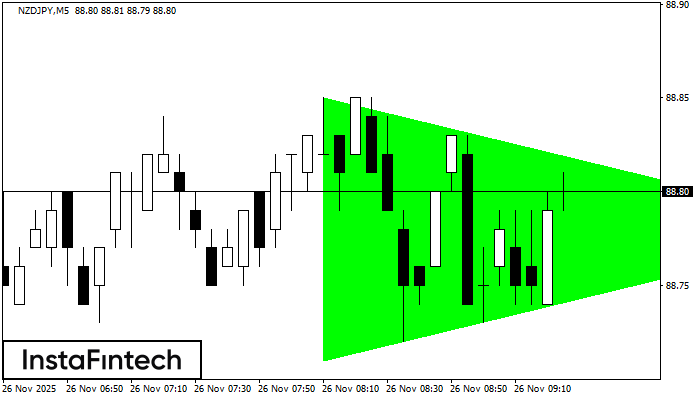
According to the chart of M5, NZDJPY formed the Bullish Symmetrical Triangle pattern. Description: This is the pattern of a trend continuation. 88.85 and 88.71 are the coordinates
The M5 and M15 time frames may have more false entry points.
Открыть график инструмента в новом окне


