

Өзекті паттерндер

Медвежий симметричный треугольник
сформирован 03.04 в 03:37:30 (UTC+0)
сила сигнала 1 из 5
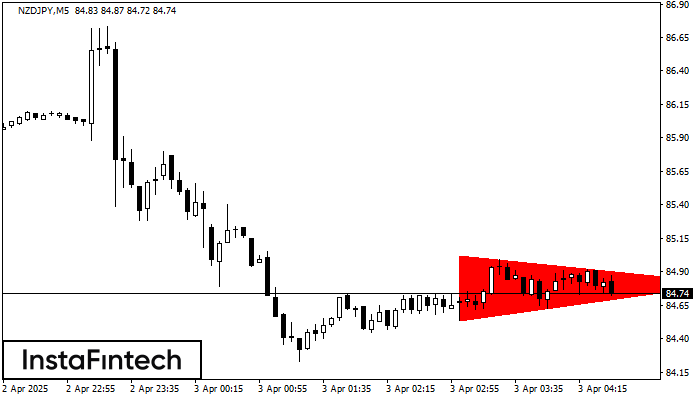
По NZDJPY M5 сформировалась фигура «Медвежий симметричный треугольник». Данная фигура сигнализирует нам о продолжении нисходящего тренда в случае пробоя нижней границы 84.54, где вероятная прибыль будет являться шириной текущей фигуры -48 пунктов.
Таймфреймы М5 и М15 могут иметь больше ложных точек входа.
- Все
- Все
- Bearish Rectangle
- Bearish Symmetrical Triangle
- Bearish Symmetrical Triangle
- Bullish Rectangle
- Double Top
- Double Top
- Triple Bottom
- Triple Bottom
- Triple Top
- Triple Top
- Все
- Все
- Покупка
- Продажа
- Все
- 1
- 2
- 3
- 4
- 5
Double Top
was formed on 07.06 at 11:00:16 (UTC+0)
signal strength 3 of 5

The Double Top reversal pattern has been formed on #Bitcoin M30. Characteristics: the upper boundary 105283.16; the lower boundary 103816.55; the width of the pattern is 147353 points. Sell trades
Open chart in a new window
Double Top
was formed on 06.06 at 22:30:10 (UTC+0)
signal strength 2 of 5

On the chart of USDCAD M15 the Double Top reversal pattern has been formed. Characteristics: the upper boundary 1.3702; the lower boundary 1.3668; the width of the pattern 34 points
The M5 and M15 time frames may have more false entry points.
Open chart in a new window
Bullish Symmetrical Triangle
was formed on 06.06 at 22:18:11 (UTC+0)
signal strength 2 of 5

According to the chart of M15, AUDJPY formed the Bullish Symmetrical Triangle pattern. The lower border of the pattern touches the coordinates 93.96/94.02 whereas the upper border goes across 94.07/94.02
The M5 and M15 time frames may have more false entry points.
Open chart in a new window


