

Өзекті паттерндер

Медвежий вымпел
сформирован 02.04 в 14:55:25 (UTC+0)
сила сигнала 1 из 5
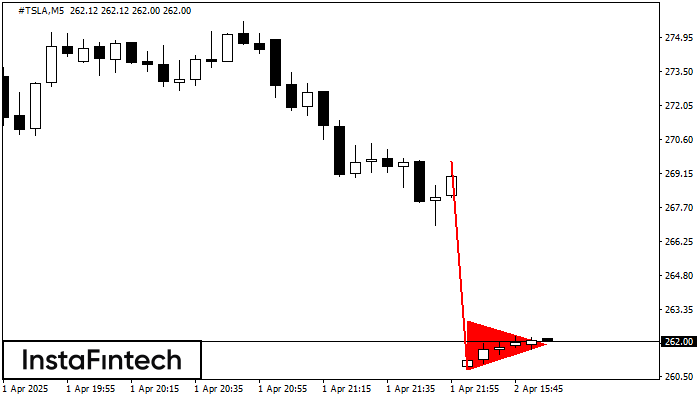
На графике #TSLA M5 сформировалась фигура «Медвежий вымпел», которая сигнализирует о возможном продолжении тренда. Характеристика: основание фигуры имеет координаты 260.80; проекция высоты флагштока равна 887 пунктов. В случае если цена преодолеет основание фигуры 260.80, то ожидается продолжение нисходящего тренда на уровень 260.65 пунктов.
Таймфреймы М5 и М15 могут иметь больше ложных точек входа.
- Все
- Все
- Bearish Rectangle
- Bearish Symmetrical Triangle
- Bearish Symmetrical Triangle
- Bullish Rectangle
- Double Top
- Double Top
- Triple Bottom
- Triple Bottom
- Triple Top
- Triple Top
- Все
- Все
- Покупка
- Продажа
- Все
- 1
- 2
- 3
- 4
- 5
Double Top
сформирован 24.04 в 16:50:28 (UTC+0)
сила сигнала 1 из 5
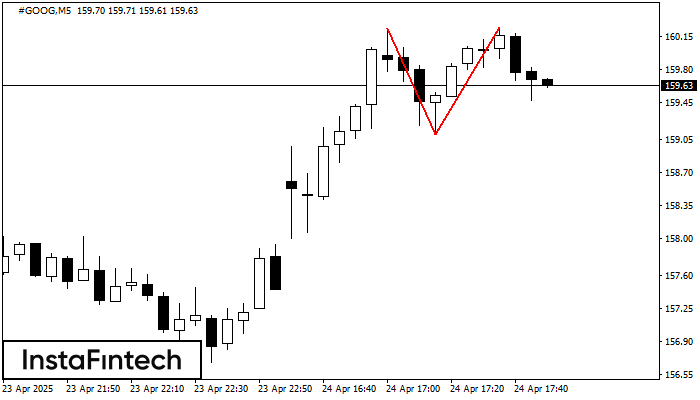
On the chart of #GOOG M5 the Double Top reversal pattern has been formed. Characteristics: the upper boundary 160.25; the lower boundary 159.11; the width of the pattern 114 points
The M5 and M15 time frames may have more false entry points.
Открыть график инструмента в новом окне
Bullish pennant
сформирован 24.04 в 16:23:38 (UTC+0)
сила сигнала 1 из 5
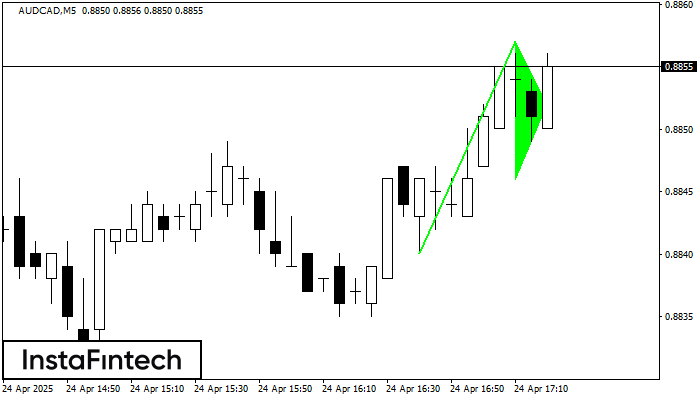
The Bullish pennant signal – Trading instrument AUDCAD M5, continuation pattern. Forecast: it is possible to set up a buy position above the pattern’s high of 0.8857, with the prospect
The M5 and M15 time frames may have more false entry points.
Открыть график инструмента в новом окне
Bullish Symmetrical Triangle
сформирован 24.04 в 16:02:25 (UTC+0)
сила сигнала 1 из 5
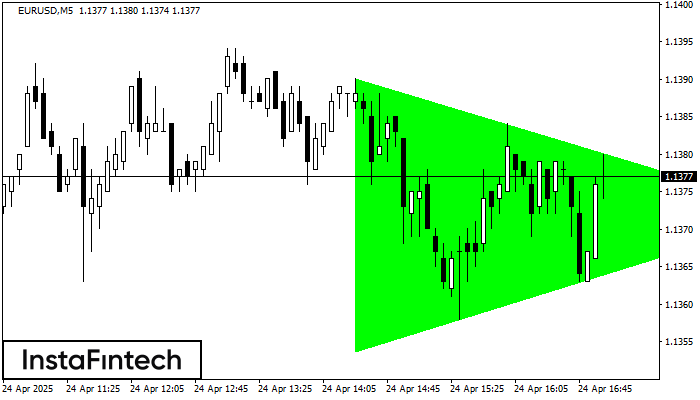
According to the chart of M5, EURUSD formed the Bullish Symmetrical Triangle pattern. Description: This is the pattern of a trend continuation. 1.1390 and 1.1354 are the coordinates
The M5 and M15 time frames may have more false entry points.
Открыть график инструмента в новом окне


