

Өзекті паттерндер

Двойное дно
сформирован 01.04 в 01:05:27 (UTC+0)
сила сигнала 1 из 5
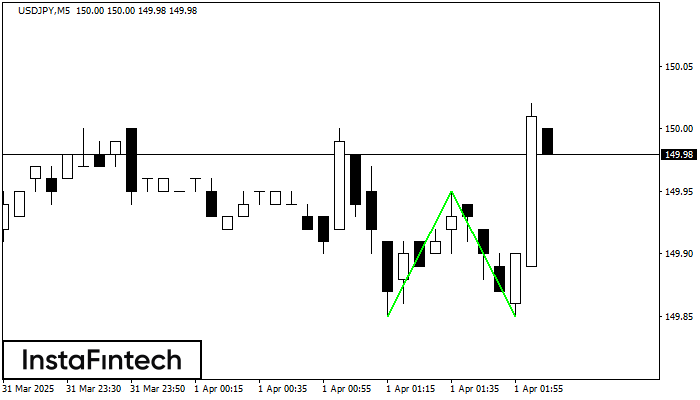
Сформирована фигура «Двойное дно» на графике USDJPY M5. Верхняя граница 149.95; Нижняя граница 149.85; Ширина фигуры 10 пунктов. В случае пробоя верхней границы 149.95 можно будет прогнозировать изменение тенденции, где ширина фигуры и будет являться расстоянием предположительного Тейк Профита.
Таймфреймы М5 и М15 могут иметь больше ложных точек входа.
Сондай-ақ қараңыз
- Все
- Все
- Bearish Rectangle
- Bearish Symmetrical Triangle
- Bearish Symmetrical Triangle
- Bullish Rectangle
- Double Top
- Double Top
- Triple Bottom
- Triple Bottom
- Triple Top
- Triple Top
- Все
- Все
- Покупка
- Продажа
- Все
- 1
- 2
- 3
- 4
- 5
Bullish Rectangle
сформирован 29.07 в 11:05:25 (UTC+0)
сила сигнала 1 из 5
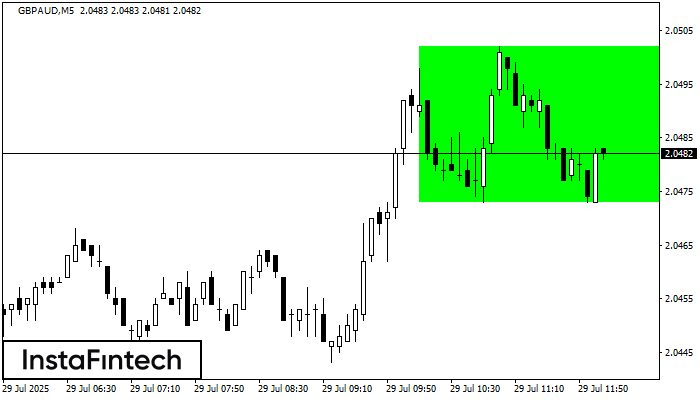
According to the chart of M5, GBPAUD formed the Bullish Rectangle which is a pattern of a trend continuation. The pattern is contained within the following borders: the lower border
The M5 and M15 time frames may have more false entry points.
Открыть график инструмента в новом окне
Bearish Rectangle
сформирован 29.07 в 08:37:44 (UTC+0)
сила сигнала 3 из 5

According to the chart of M30, NZDCAD formed the Bearish Rectangle which is a pattern of a trend continuation. The pattern is contained within the following borders: lower border 0.8187
Открыть график инструмента в новом окне
Bearish Rectangle
сформирован 29.07 в 08:37:24 (UTC+0)
сила сигнала 4 из 5

According to the chart of H1, NZDCAD formed the Bearish Rectangle. This type of a pattern indicates a trend continuation. It consists of two levels: resistance 0.8203 - 0.0000
Открыть график инструмента в новом окне


