

Өзекті паттерндер

Двойное дно
сформирован 31.03 в 02:45:08 (UTC+0)
сила сигнала 1 из 5
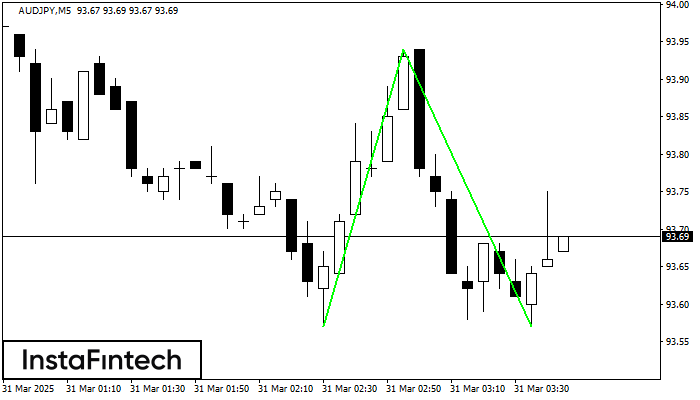
Сформирована фигура «Двойное дно» на графике AUDJPY M5. Данное формирование сигнализирует об изменении тенденции с нисходящего на восходящее движение. Сигнал: Торговую позицию на покупку следует открывать после пробоя верхней границы фигуры 93.94, где перспектива будущего хода будет являться шириной текущей фигуры - 37 пунктов.
Таймфреймы М5 и М15 могут иметь больше ложных точек входа.
Сондай-ақ қараңыз
- Все
- Все
- Bearish Rectangle
- Bearish Symmetrical Triangle
- Bearish Symmetrical Triangle
- Bullish Rectangle
- Double Top
- Double Top
- Triple Bottom
- Triple Bottom
- Triple Top
- Triple Top
- Все
- Все
- Покупка
- Продажа
- Все
- 1
- 2
- 3
- 4
- 5
Bearish Symmetrical Triangle
was formed on 04.06 at 04:16:58 (UTC+0)
signal strength 2 of 5
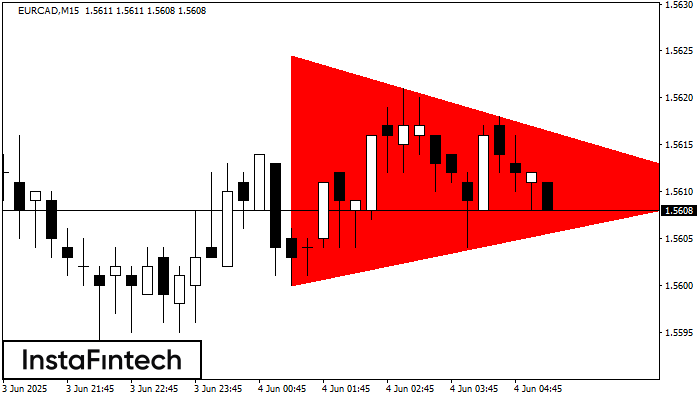
According to the chart of M15, EURCAD formed the Bearish Symmetrical Triangle pattern. This pattern signals a further downward trend in case the lower border 1.5600 is breached. Here
The M5 and M15 time frames may have more false entry points.
Open chart in a new window
Double Top
was formed on 04.06 at 04:00:27 (UTC+0)
signal strength 3 of 5
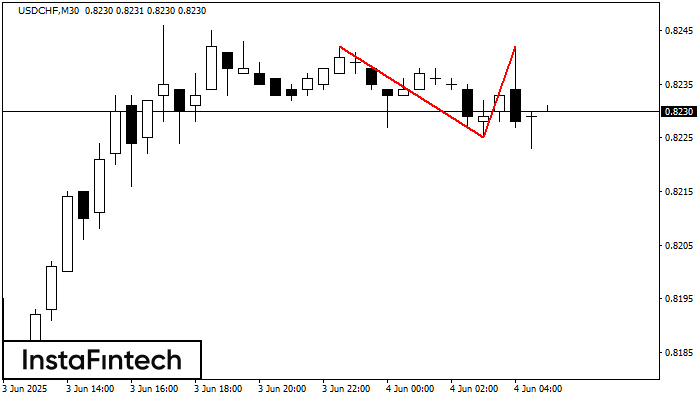
The Double Top reversal pattern has been formed on USDCHF M30. Characteristics: the upper boundary 0.8242; the lower boundary 0.8225; the width of the pattern is 17 points. Sell trades
Open chart in a new window
Triple Top
was formed on 04.06 at 04:00:18 (UTC+0)
signal strength 3 of 5
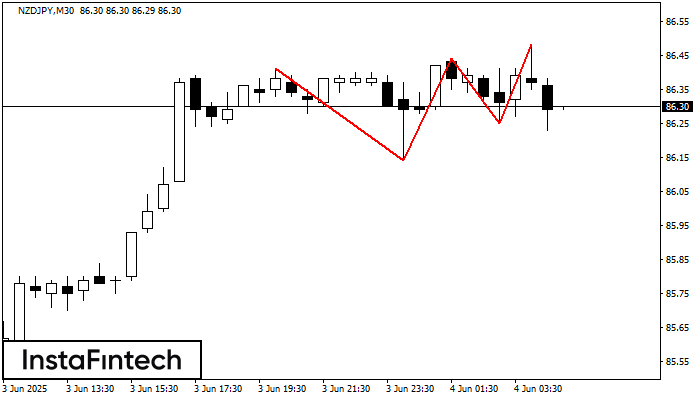
The Triple Top pattern has formed on the chart of the NZDJPY M30 trading instrument. It is a reversal pattern featuring the following characteristics: resistance level -7, support level -11
Open chart in a new window


